Page 1 of 1
Analyze the bridge shown in the figure. Using influence diagrams, it has been determined that in order to produce the ma
Posted: Tue Apr 26, 2022 1:09 pm
by answerhappygod
- Analyze The Bridge Shown In The Figure Using Influence Diagrams It Has Been Determined That In Order To Produce The Ma 1 (67.78 KiB) Viewed 55 times
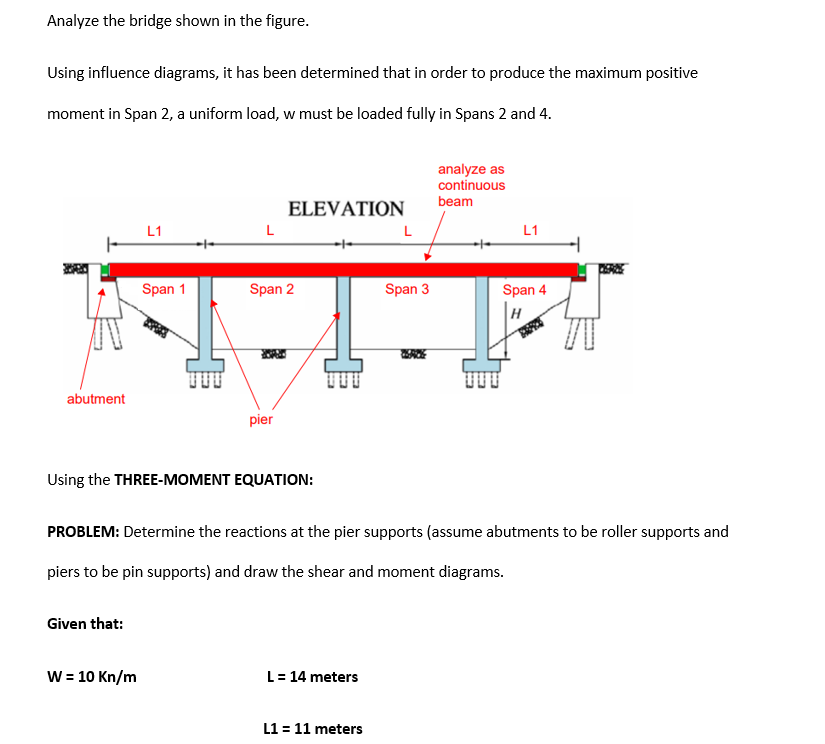
Analyze the bridge shown in the figure. Using influence diagrams, it has been determined that in order to produce the maximum positive moment in Span 2, a uniform load, w must be loaded fully in Spans 2 and 4. analyze as continuous beam ELEVATION L L1 L L1 Span 1 Span 2 Span 3 Span 4 abutment pier Using the THREE-MOMENT EQUATION: PROBLEM: Determine the reactions at the pier supports (assume abutments to be roller supports and piers to be pin supports) and draw the shear and moment diagrams. Given that: W = 10 Kn/m L = 14 meters L1 = 11 meters