Page 1 of 1
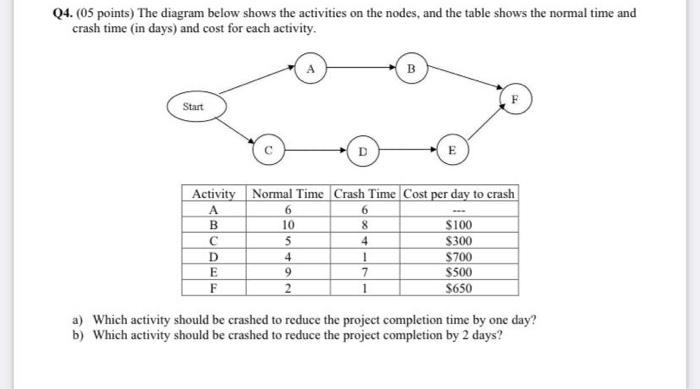
Q4. (05 points) The diagram below shows the activities on the nodes, and the table shows the normal time and crash time
Posted: Tue Apr 26, 2022 12:31 pm
by answerhappygod
- Q4 05 Points The Diagram Below Shows The Activities On The Nodes And The Table Shows The Normal Time And Crash Time 1 (29.07 KiB) Viewed 42 times
Q4. (05 points) The diagram below shows the activities on the nodes, and the table shows the normal time and crash time (in days) and cost for each activity. B Start D Activity Normal Time Crash Time Cost per day to crash A 6 6 B 10 8 $100 C 5 4 $300 D 4 1 $700 E 9 7 $500 F 2 1 $650 a) Which activity should be crashed to reduce the project completion time by one day? b) Which activity should be crashed to reduce the project completion by 2 days?