Page 1 of 1
Following are the data on demand for white bread loaves at a bakery. Loaves 199 209 Day 1 2 3 4 5 6 7 8 9 10 11 12 13 14
Posted: Tue Apr 26, 2022 12:15 pm
by answerhappygod
- Following Are The Data On Demand For White Bread Loaves At A Bakery Loaves 199 209 Day 1 2 3 4 5 6 7 8 9 10 11 12 13 14 1 (353.87 KiB) Viewed 50 times
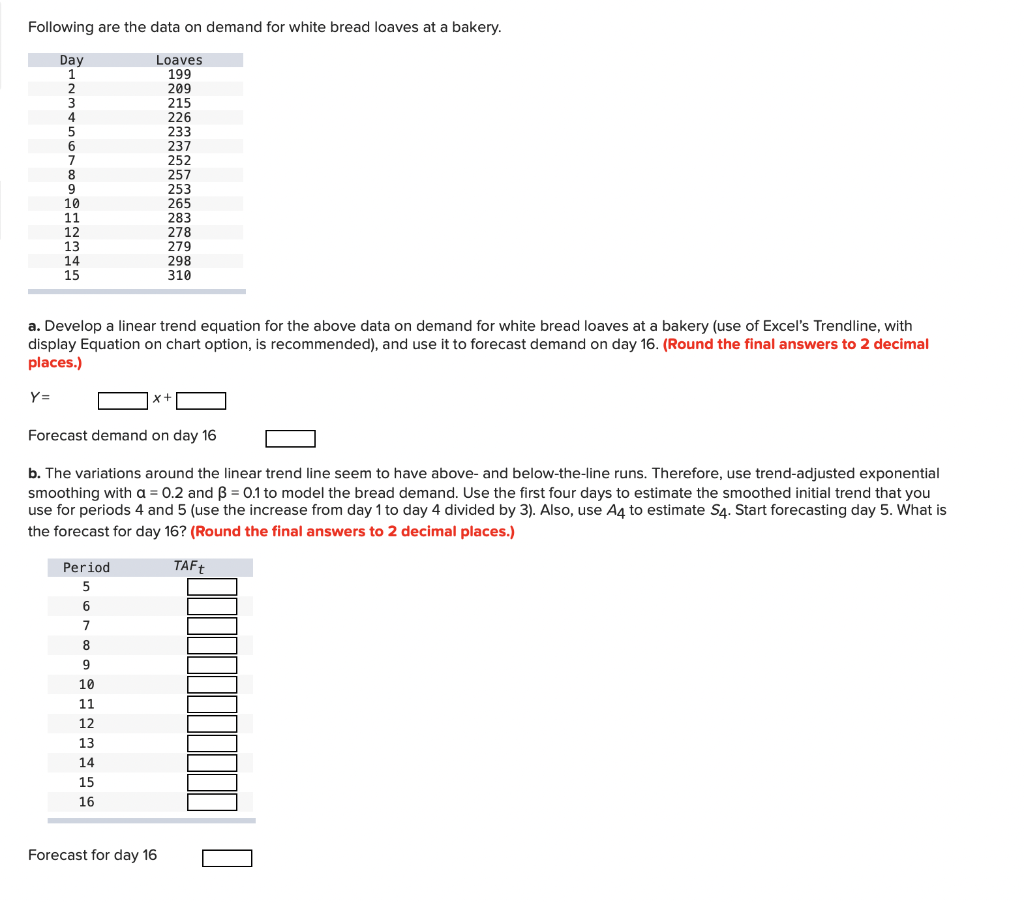
Following are the data on demand for white bread loaves at a bakery. Loaves 199 209 Day 1 2 3 4 5 6 7 8 9 10 11 12 13 14 15 215 226 233 237 252 257 253 265 283 278 279 298 310 WHBHF a. Develop a linear trend equation for the above data on demand for white bread loaves at a bakery (use of Excel's Trendline, with display Equation on chart option, is recommended), and use it to forecast demand on day 16. (Round the final answers to 2 decimal places.) Y= x+ Forecast demand on day 16 b. The variations around the linear trend line seem to have above- and below-the-line runs. Therefore, use trend-adjusted exponential smoothing with a = 0.2 and ß = 0.1 to model the bread demand. Use the first four days to estimate the smoothed initial trend that you use for periods 4 and 5 (use the increase from day 1 to day 4 divided by 3). Also, use A4 to estimate 94. Start forecasting day 5. What is the forecast for day 16? (Round the final answers to 2 decimal places.) TAFt Period 5 6 7 8 8 9 10 11 12 13 14 15 16 Forecast for day 16 O