- E Homework Hw2 Cap Budgeting Cf Estimation Question 9 P11 20 Similar To Part 1 Of 12 Hw Score 10 1 Of 10 Points O 1 (116.3 KiB) Viewed 47 times
- E Homework Hw2 Cap Budgeting Cf Estimation Question 9 P11 20 Similar To Part 1 Of 12 Hw Score 10 1 Of 10 Points O 2 (78.72 KiB) Viewed 47 times
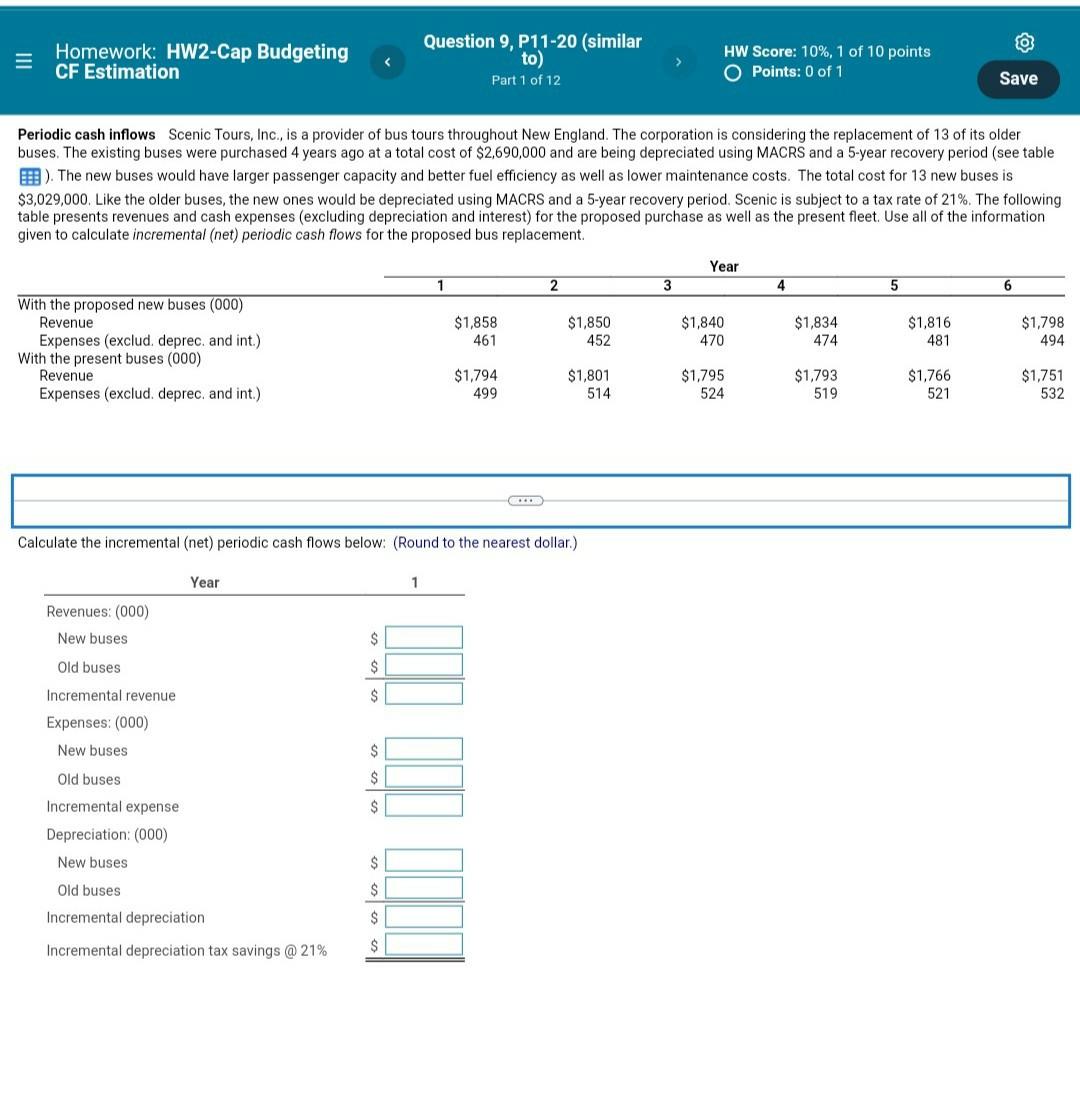
E Homework: HW2-Cap Budgeting CF Estimation Question 9, P11-20 (similar to) Part 1 of 12 HW Score: 10%, 1 of 10 points O Points: 0 of 1 Save Periodic cash inflows Scenic Tours, Inc., is a provider of bus tours throughout New England. The corporation is considering the replacement of 13 of its older buses. The existing buses were purchased 4 years ago at a total cost of $2,690,000 and are being depreciated using MACRS and a 5-year recovery period (see table 2). The new buses would have larger passenger capacity and better fuel efficiency as well as lower maintenance costs. The total cost for 13 new buses is $3,029,000. Like the older buses, the new ones would be depreciated using MACRS and a 5-year recovery period. Scenic is subject to a tax rate of 21%. The following table presents revenues and cash expenses (excluding depreciation and interest) for the proposed purchase as well as the present fleet. Use all of the information given to calculate incremental (net) periodic cash flows for the proposed bus replacement. Year 1 2 3 4 5 6 $1,858 461 $1,850 452 $1,840 470 $1,834 474 $1,816 481 $1,798 494 With the proposed new buses (000) Revenue Expenses (exclud. deprec. and int.) With the present buses (000) Revenue Expenses (exclud. deprec. and int.) $1,766 $1,794 499 $1,801 514 $1,795 524 $1,793 519 521 $1,751 532 Calculate the incremental (net) periodic cash flows below: (Round to the nearest dollar.) Year 1 Revenues: (000) New buses $ Old buses $ $ Incremental revenue Expenses: (000) New buses $ Old buses $ Incremental expense $ Depreciation: (000) New buses $ Old buses $ Incremental depreciation $ Incremental depreciation tax savings @ 21% $
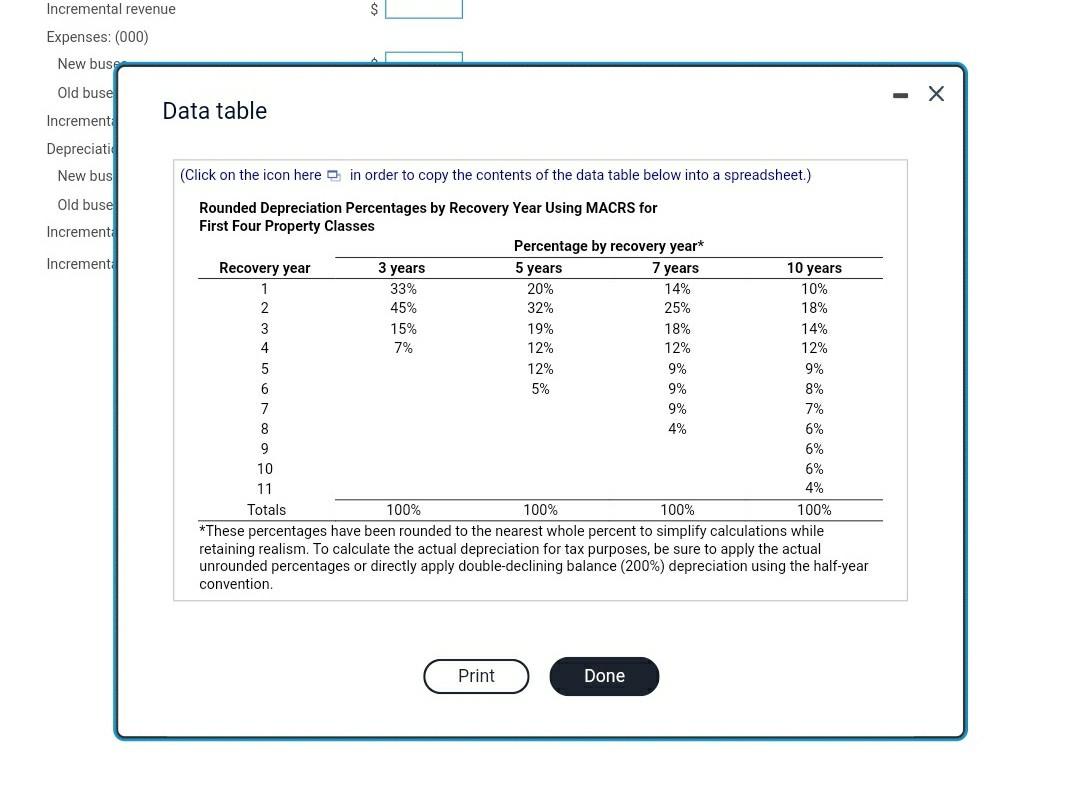
$ Incremental revenue Expenses: (000) New buse Old buse - X Data table Increment Depreciati New bus Old buse Increment Increment 15% (Click on the icon here in order to copy the contents of the data table below into a spreadsheet.) Rounded Depreciation Percentages by Recovery Year Using MACRS for First Four Property Classes Percentage by recovery year* Recovery year 3 years 5 years 7 years 10 years 33% 20% 14% 10% 2 45% 32% 25% 18% 19% 18% 14% 4 7% 12% 12% 12% 5 12% 9% 9% 6 5% 9% 8% 7 9% 7% 8 4% 6% 9 6% 10 6% 11 4% Totals 100% 100% 100% 100% *These percentages have been rounded to the nearest whole percent to simplify calculations while retaining realism. To calculate the actual depreciation for tax purposes, be sure to apply the actual unrounded percentages or directly apply double-declining balance (200%) depreciation using the half-year convention Print Done