- While It Is Difficult To Directly Estimate The Temperature Of A Star From The Lines In Its Absorption Spectrum We Can A 1 (42.01 KiB) Viewed 25 times
- While It Is Difficult To Directly Estimate The Temperature Of A Star From The Lines In Its Absorption Spectrum We Can A 2 (30.01 KiB) Viewed 25 times
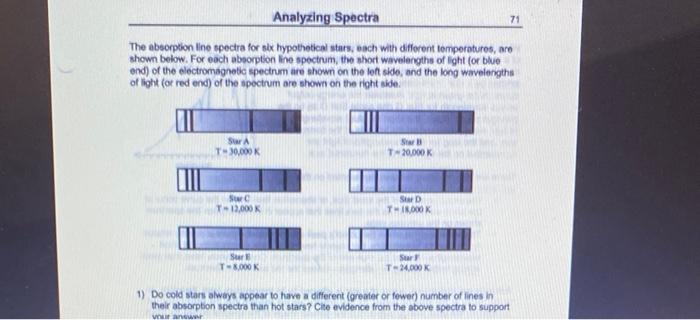
The absorption line spectra for six hypothetical stars, each with different temperatures, areshown below. For each absorption line spectrum, the short wavelengths of light (or blueend) of the electromagnetic spectrum are shown on the left side, and the long wavelengthsof light (or red end) of the spectrum are shown on the right side
The absorption line spectra for six hypothetical stars, each with different temperatures, are
shown below. For each absorption line spectrum, the short wavelengths of light (or blue
end) of the electromagnetic spectrum are shown on the left side, and the long wavelengths
of light (or red end) of the spectrum are shown on the right side
1. Do cold stars always appear to have a different (greater or fewer) number of lines intheir absorption spectra than hot stars? Cite evidence from the above spectra to supportyour answer.2) Do cold stars always appear to have more lines at either the blue or red ends of theirabsorption spectra than hot stars? Cite evidence from the above spectra to support your answer.
1. Do cold stars always appear to have a different (greater or fewer) number of lines in
their absorption spectra than hot stars? Cite evidence from the above spectra to support
your answer.
2) Do cold stars always appear to have more lines at either the blue or red ends of their
absorption spectra than hot stars? Cite evidence from the above spectra to support your answer.

- While It Is Difficult To Directly Estimate The Temperature Of A Star From The Lines In Its Absorption Spectrum We Can A 3 (30.01 KiB) Viewed 25 times
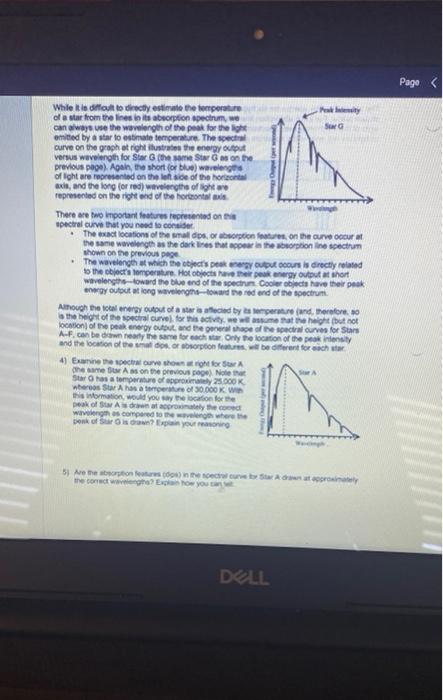
While it is difficult to directly estimate the temperature of a star from the lines in its absorption spectrum, we can always use the wavelength of the peak for the I emitted by a star to estimate temperature. The spectral curve on the graph at right illustrates the energy output versus wavelength for Star G (the same Star G as on the previous page). Again, the short (or blue) wavelengt of light are represented on the left side of the horizontal axis, and the long (or red) wavelengths of light are represented on the right end of the horizontal axis There are two important features represented on the spectral curve that you need to consider The exact locations of the small dips, or absorption features, on the curve occur at the same wavelength as the dark lines that appear in the absorption line spectrum shown on the previous page The wavelength at which the object's peak energy output occurs is directly related to the object's temperature. Hot objects have their peak energy output at short wavelengths toward the blue end of the spectrum Cooler objects have their peak energy output at long wavelengths-toward the red end of the spectrum 4) Examine the spectral curve shown at right for Star A the same Star A as on the previous page). Note that Star G has a temperature of approximately 25.000 K whereas Star A has a temperature of 30.000 K W this information, would you say the location for the peak of Star A is drawn at approximately the conect wavelength as compared to the wavelength where the penk of Star G is drawn? Explain your reasoning Peakty Sur G Although the total energy output of a star is affected by its temperature (and, therefore, so is the height of the spectral curve), for this activity, we will assume that the height (but not location) of the peak energy output, and the general shape of the spectral curves for Stars A-F, can be drawn nearly the same for each star. Only the location of the peak intensity and the location of the small dips or absorption features, will be different for each star CÁ NHÂN LÀ KHÁ Wirdigh DELL 5) Are the absorption features (dos) in the spectral curve by Star A drawn at approximately the correct wavelengths? Explain how you can Page
Analyzing Spectra The absorption line spectra for six hypothetical stars, each with different temperatures, are shown below. For each absorption line spectrum, the short wavelengths of light (or blue end) of the electromagnetic spectrum are shown on the left side, and the long wavelengths of light (or red end) of the spectrum are shown on the right side. Star A T-30,000 K Sue C -12,000 K Sur T-8,000 K Star B T-20,000 K Star D T-18,000 K Sur F T-24,000 K 71 1) Do cold stars always appear to have a different (greater or fewer) number of lines in their absorption spectra than hot stars? Cite evidence from the above spectra to support your answer