Page 1 of 1
INCIDENCE OF ADOPTION-S-SHAPED CURVE Below is a dataset that shows the percent of a population by men and women living i
Posted: Tue Jul 12, 2022 1:33 pm
by answerhappygod
- Incidence Of Adoption S Shaped Curve Below Is A Dataset That Shows The Percent Of A Population By Men And Women Living I 1 (167.27 KiB) Viewed 27 times
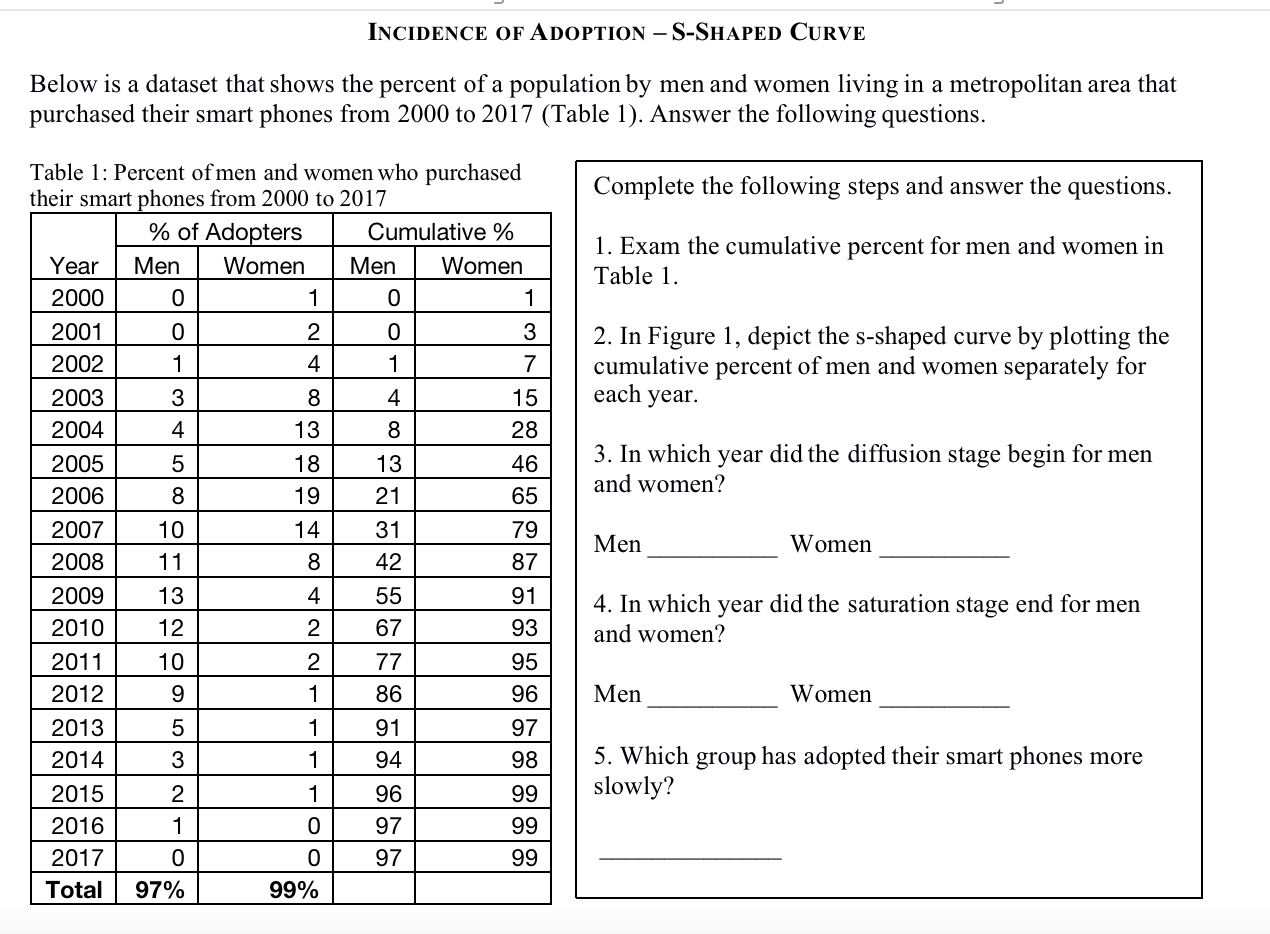
INCIDENCE OF ADOPTION-S-SHAPED CURVE Below is a dataset that shows the percent of a population by men and women living in a metropolitan area that purchased their smart phones from 2000 to 2017 (Table 1). Answer the following questions. Table 1: Percent of men and women who purchased their smart phones from 2000 to 2017 % of Adopters Women Year Men 2000 2001 2002 2003 2004 2005 2006 0 0 1 3 4 5 8 2007 10 2008 11 2009 13 2010 12 2011 10 2012 9 5 3 2 1 0 2013 2014 2015 2016 2017 Total 97% 1 2 4 8 13 18 19 14 8 4 2 2 1 1 1 1 0 0 99% Cumulative % Women Men 0 0 1 4 8 13 21 31 42 55 67 77 86 91 94 96 97 97 1 3 7 15 28 46 65 79 87 91 93 95 96 97 98 99 99 99 Complete the following steps and answer the questions. 1. Exam the cumulative percent for men and women in Table 1. 2. In Figure 1, depict the s-shaped curve by plotting the cumulative percent of men and women separately for each year. 3. In which year did the diffusion stage begin for men and women? Men Women 4. In which year did the saturation stage end for men and women? Men Women 5. Which group has adopted their smart phones more slowly?
Cumulative Percent (%) 100 90 80 70 60 50 40 30 20 10 0 00 01 02 03 04 05 06 07 08 09 10 11 12 13 14 15 16 17 Year Figure 1: Y-axis represents the cumulative percent and x-axis represents years from 00 (2000) to 17 (2017)