Page 1 of 1
Question 4 Below is a profit diagram for a position. All options are European, have 1 year to maturity, and the stock pr
Posted: Tue Apr 26, 2022 10:33 am
by answerhappygod
- Question 4 Below Is A Profit Diagram For A Position All Options Are European Have 1 Year To Maturity And The Stock Pr 1 (108.02 KiB) Viewed 44 times
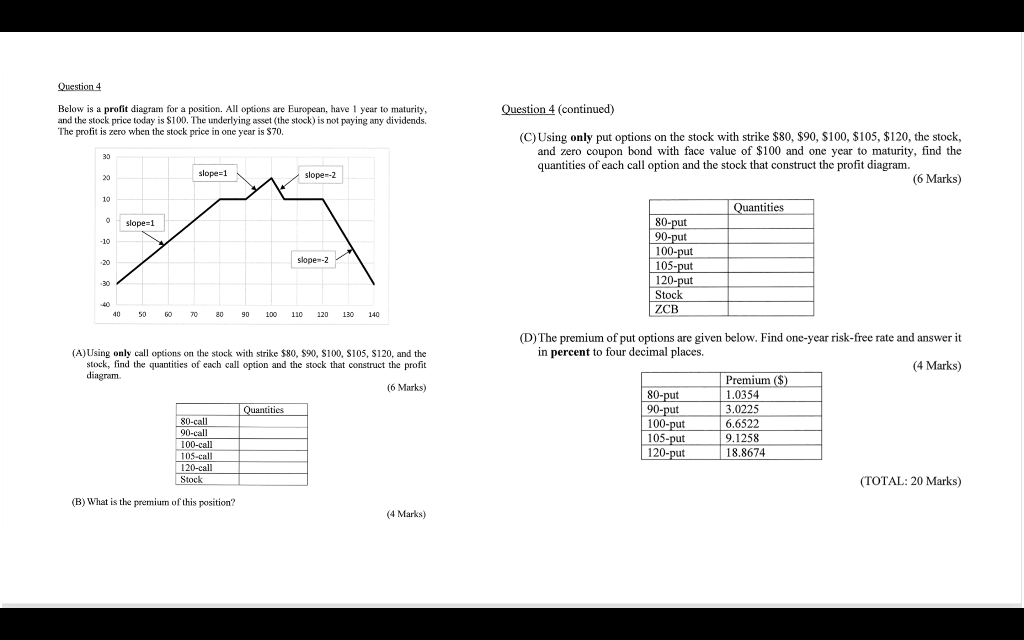
Question 4 Below is a profit diagram for a position. All options are European, have 1 year to maturity, and the stock price today is $100. The underlying asset (the stock) is not paying any dividends. The profit is zero when the stock price in one year is $70. Question 4 (continued) 30 (C) Using only put options on the stock with strike $80, $90, $100, $105, $120, the stock, and zero coupon bond with face value of $100 and one year to maturity, find the quantities of each call option and the stock that construct the profit diagram. (6 Marks) slope=1 20 slope-2 10 Quantities 0 slope=1 -10 slope-2 80-put 90-put 100-put 105-put 120-put Stock ZCB 30 40 50 GO 70 80 90 100 110 120 130 140 (A)Using only call options on the stock with strike $80, S90, S100, S105, S120, and the stock, find the quantities of each call option and the stock that construct the profit diagram (6 Marks) 6 (D) The premium of put options are given below. Find one-year risk-free rate and answer it in percent to four decimal places. (4 Marks) ) Premium $ 80-put 1.0354 90-put 3.0225 100-put 6.6522 105-put 9.1258 120-put 18.8674 Quantities 80-call 90-call 100-call 105-call 120-call Stock (TOTAL: 20 Marks) (B) What is the premium of this position? (4 Marks)