Page 1 of 1
DATA AND OBSERVATIONS Qualitative observations should be detailed and explicit. Data (quantitative observations) should
Posted: Tue Jul 12, 2022 1:07 pm
by answerhappygod
- Data And Observations Qualitative Observations Should Be Detailed And Explicit Data Quantitative Observations Should 1 (71.11 KiB) Viewed 37 times
- Data And Observations Qualitative Observations Should Be Detailed And Explicit Data Quantitative Observations Should 2 (23.81 KiB) Viewed 37 times
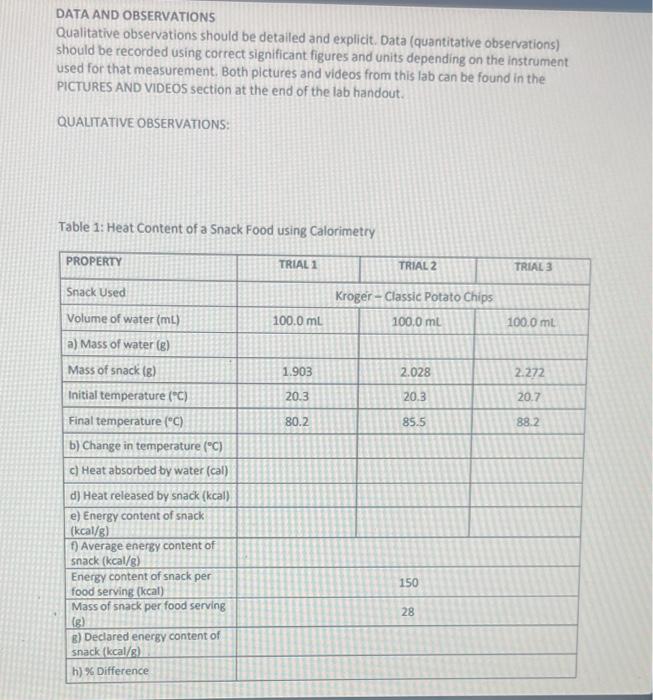
DATA AND OBSERVATIONS Qualitative observations should be detailed and explicit. Data (quantitative observations) should be recorded using correct significant figures and units depending on the instrument used for that measurement. Both pictures and videos from this lab can be found in the PICTURES AND VIDEOS section at the end of the lab handout. QUALITATIVE OBSERVATIONS: Table 1: Heat Content of a Snack Food using Calorimetry PROPERTY Snack Used Volume of water (ml) a) Mass of water (g) Mass of snack (g) Initial temperature (°C) Final temperature (°C) b) Change in temperature (°C) c) Heat absorbed by water (cal) d) Heat released by snack (kcal) e) Energy content of snack (kcal/g) f) Average energy content of snack (kcal/g) Energy content of snack per food serving (kcal) Mass of snack per food serving g) Declared energy content of snack (kcal/g) h) % Difference TRIAL 1 100.0 mL 1.903 20.3 80.2 TRIAL 2 Kroger - Classic Potato Chips 100.0 mL 2.028 20.3 85.5 150 28 TRIAL 3 100.0 mL 2.272 20.7 88.2
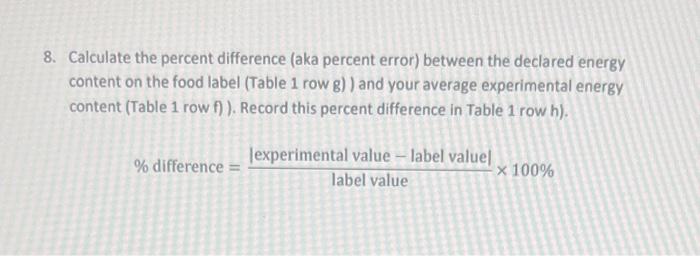
8. Calculate the percent difference (aka percent error) between the declared energy content on the food label (Table 1 row g) ) and your average experimental energy content (Table 1 row f) ). Record this percent difference in Table 1 row h). % difference = lexperimental value - label value] label value x 100%