Page 1 of 1
4. [Maximum mark: 5] The following diagram shows the graph of y = f(x). The graph has a horizontal asymptote at y=-1. Th
Posted: Tue Jul 12, 2022 12:41 pm
by answerhappygod
- 4 Maximum Mark 5 The Following Diagram Shows The Graph Of Y F X The Graph Has A Horizontal Asymptote At Y 1 Th 1 (67.93 KiB) Viewed 58 times
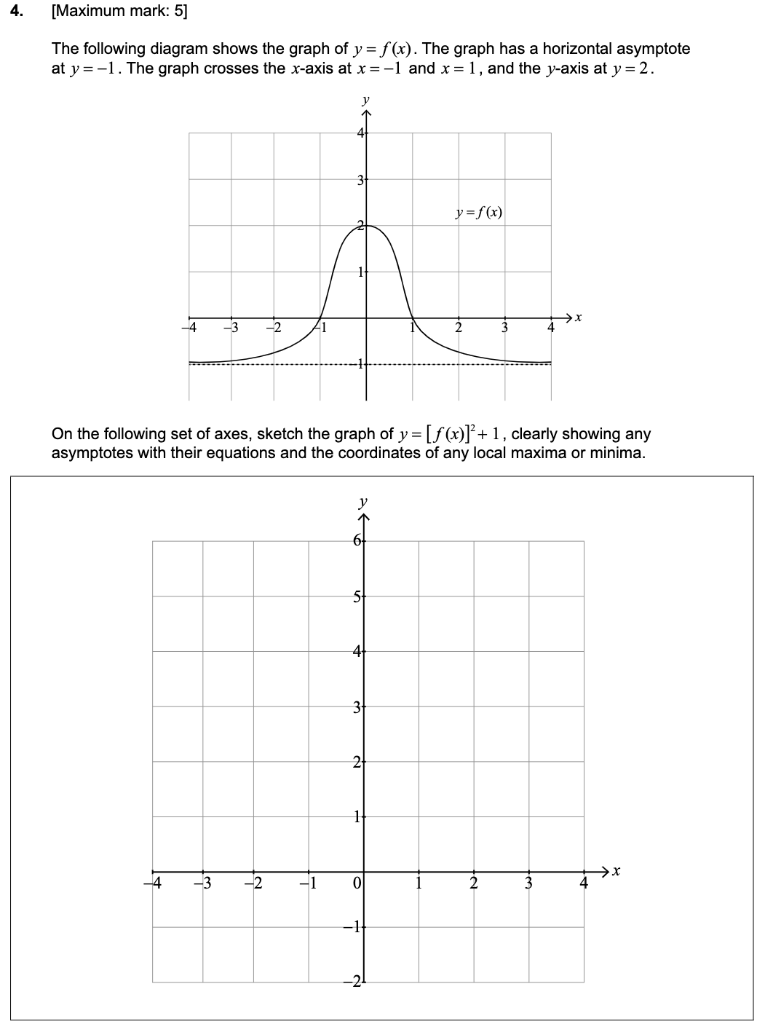
4. [Maximum mark: 5] The following diagram shows the graph of y = f(x). The graph has a horizontal asymptote at y=-1. The graph crosses the x-axis at x = -1 and x = 1, and the y-axis at y = 2. 4 -3 -2 -4 On the following set of axes, sketch the graph of y=[f(x)]²+ 1, clearly showing any asymptotes with their equations and the coordinates of any local maxima or minima. -1 y 1 01 y=f(x) -1