Page 1 of 1
1. Plot the standard titration curve in Excel by plotting Volume of Titrant (mL) on the x- axis and pH on the y-axis. La
Posted: Mon Jul 11, 2022 1:55 pm
by answerhappygod
- 1 Plot The Standard Titration Curve In Excel By Plotting Volume Of Titrant Ml On The X Axis And Ph On The Y Axis La 1 (102.6 KiB) Viewed 41 times
- 1 Plot The Standard Titration Curve In Excel By Plotting Volume Of Titrant Ml On The X Axis And Ph On The Y Axis La 2 (31.71 KiB) Viewed 41 times
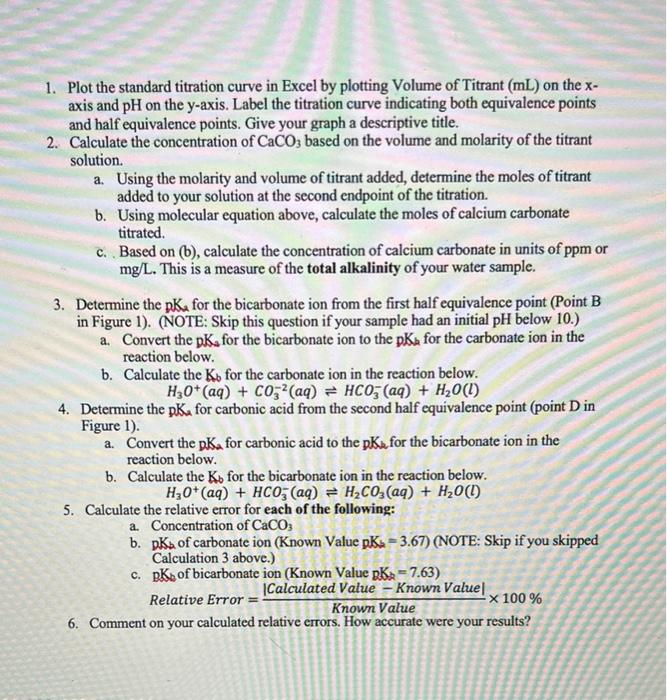
1. Plot the standard titration curve in Excel by plotting Volume of Titrant (mL) on the x- axis and pH on the y-axis. Label the titration curve indicating both equivalence points and half equivalence points. Give your graph a descriptive title. 2. Calculate the concentration of CaCO3 based on the volume and molarity of the titrant solution. a. Using the molarity and volume of titrant added, determine the moles of titrant added to your solution at the second endpoint of the titration. b. Using molecular equation above, calculate the moles of calcium carbonate titrated. c. Based on (b), calculate the concentration of calcium carbonate in units of ppm or mg/L. This is a measure of the total alkalinity of your water sample. 3. Determine the pK, for the bicarbonate ion from the first half equivalence point (Point B in Figure 1). (NOTE: Skip this
question if your sample had an initial pH below 10.) a. Convert the pK, for the bicarbonate ion to the pKa for the carbonate ion in the reaction below. b. Calculate the Ko for the carbonate ion in the reaction below. H30+ (aq) + CO2(aq) = HCO3(aq) + H₂O(l) 4. Determine the pK, for carbonic acid from the second half equivalence point (point D in Figure 1). a. Convert the pKa for carbonic acid to the pK, for the bicarbonate ion in the reaction below. b. Calculate the Kb for the bicarbonate ion in the reaction below. H₂0+ (aq) + HCO3(aq) = H₂CO3(aq) + H₂O(l) 5. Calculate the relative error for each of the following: a. Concentration of CaCO3 b. pk of carbonate ion (Known Value pK-3.67) (NOTE: Skip if you skipped Calculation 3 above.) c. pk of bicarbonate ion (Known Value DK-7.63) Relative Error = Calculated Value - Known Value] Known Value -x 100% 6. Comment on your calculated relative errors. How accurate were your results?
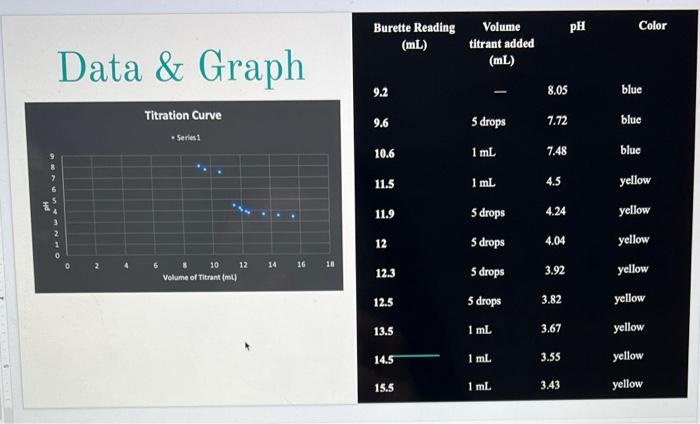
Data & Graph Titration Curve Series1 10 Volume of Titrant (ml) 12 14 16 18 Burette Reading (mL) 9.2 9.6 10.6 11.5 11.9 12 12.3 12.5 13.5 14.5 15.5 Volume titrant added (mL) 5 drops 1 mL I 1 mL 5 drops 5 drops 5 drops 5 drops 1 mL 1 mL 1 mL 8.05 7.72 7.48 4.5 4.24 4.04 3.92 3.82 3.67 PH 3.55 3.43 Color blue blue blue yellow yellow yellow yellow yellow yellow yellow yellow