- The Graph Below Shows The Level Curves Of A Differentiable Function F X Y Thin Curves As Well As The Constraint G X 1 (65.01 KiB) Viewed 59 times
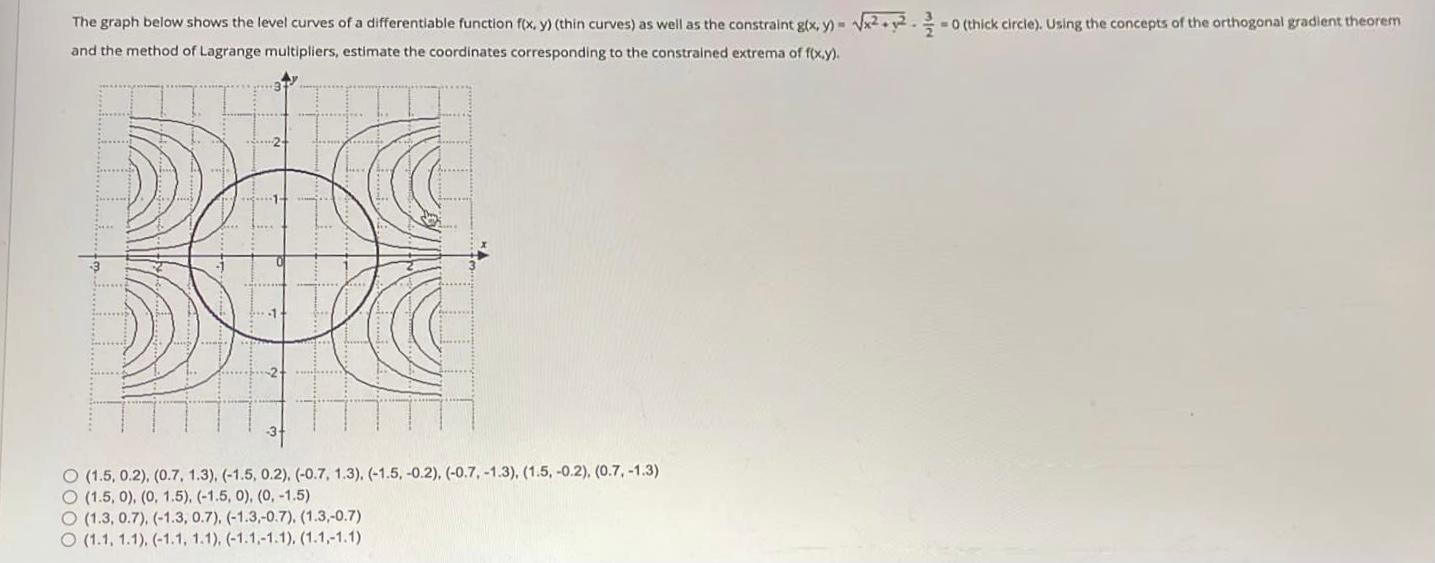
The graph below shows the level curves of a differentiable function f(x, y) (thin curves) as well as the constraint g(x, y)=√x²+²=0 (thick circle). Using the concepts of the orthogonal gradient theorem and the method of Lagrange multipliers, estimate the coordinates corresponding to the constrained extrema of f(x,y). O (1.5, 0.2), (0.7, 1.3), (-1.5, 0.2), (-0.7, 1.3), (-1.5, -0.2), (-0.7, -1.3), (1.5, -0.2), (0.7.-1.3) O (1.5, 0), (0, 1.5), (-1.5, 0), (0, -1.5) O (1.3, 0.7), (-1.3, 0.7), (-1.3,-0.7), (1.3,-0.7) O (1.1, 1.1), (-1.1, 1.1), (-1.1,-1.1), (1.1,-1.1)