Page 1 of 1
20. The following experiment was conducted to see if the kind of feedback beginning baseball players receives has an imp
Posted: Mon Jul 11, 2022 11:59 am
by answerhappygod
- 20 The Following Experiment Was Conducted To See If The Kind Of Feedback Beginning Baseball Players Receives Has An Imp 1 (26.65 KiB) Viewed 50 times
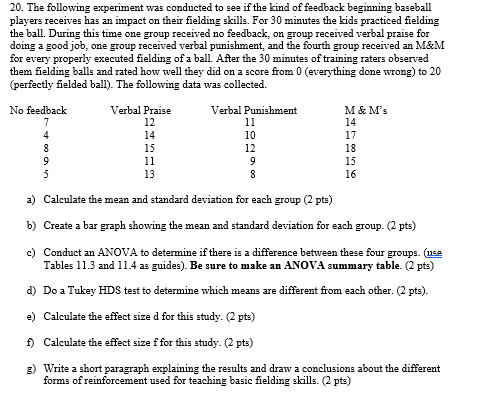
20. The following experiment was conducted to see if the kind of feedback beginning baseball players receives has an impact on their fielding skills. For 30 minutes the kids practiced fielding the ball. During this time one group received no feedback, on group received verbal praise for doing a good job, one group received verbal punishment, and the fourth group received an M&M for every properly executed fielding of a ball. After the 30 minutes of training raters observed them fielding balls and rated how well they did on a score from 0 (everything done wrong) to 20 (perfectly fielded ball). The following data was collected. No feedback 7 4 8 9 5 الرا Verbal Praise 12 14 15 11 13 Verbal Punishment 11 10 12 9 8 M & M's 14 17 18 15 16 a) Calculate the mean and standard deviation for each group (2 pts) b) Create a bar graph showing the mean and standard deviation for each group. (2 pts) c) Conduct an ANOVA to determine if there is a difference between these four groups. (use Tables 11.3 and 11.4 as guides). Be sure to make an ANOVA summary table. (2 pts) d) Do a Tukey HDS test to determine which means are different from each other. (2 pts). e) Calculate the effect size d for this study. (2 pts) f) Calculate the effect size f for this study. (2 pts) g) Write a short paragraph explaining the results and draw a conclusions about the different forms of reinforcement used for teaching basic fielding skills. (2 pts)
21. The following experiment was conducted to see if the color of paper used for an exam has in impact on the exam scores. Students were randomly placed into one of four groups, each receiving a different color of paper. The following exam scores were collected (possible scores were 0 to 100. The following data was collected. White Paper 87 84 78 79 89 Red Paper 72 68 70 74 73 Yellow Paper 80 82 78 79 81 Salmon Paper 89 91 93 90 92 a) Calculate the mean and standard deviation for each group (2 pts) (2 pts) b) Create a bar graph showing the mean and standard deviation for each group. c) Conduct an ANOVA to determine if there is a difference between these four groups. (use Tables 11.3 and 11.4 as guides). Be sure to make an ANOVA summary table. (2 pts) d) Do a Tukey HDS test to determine which means are different from each other. (2 pts). e) Calculate the effect size d for this study. (2 pts) f) Calculate the effect size f for this study. (2 pts) g) Write a short paragraph explaining the results and draw a conclusions about the different colors of paper used for giving exams. (2 pts)