Page 1 of 1
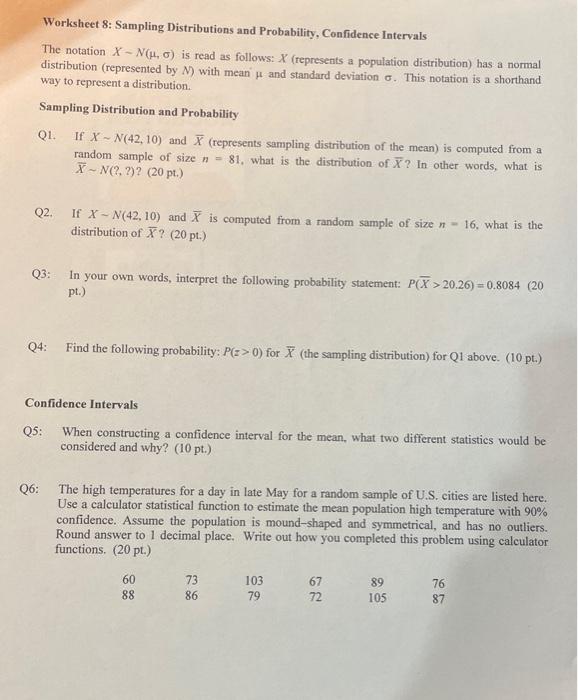
Worksheet 8: Sampling Distributions and Probability, Confidence Intervals The notation X-N(u, o) is read as follows: X (
Posted: Mon Jul 11, 2022 11:51 am
by answerhappygod
- Worksheet 8 Sampling Distributions And Probability Confidence Intervals The Notation X N U O Is Read As Follows X 1 (49.54 KiB) Viewed 35 times
Worksheet 8: Sampling Distributions and Probability, Confidence Intervals The notation X-N(u, o) is read as follows: X (represents a population distribution) has a normal distribution (represented by N) with mean μ and standard deviation o. This notation is a shorthand way to represent a distribution. Sampling Distribution and Probability Q1. Q2. If X-N(42, 10) and X (represents sampling distribution of the mean) is computed from a random sample of size n= 81, what is the distribution of X? In other words, what is X-N(?, ?)? (20 pt.) If X-N(42, 10) and X is computed from a random sample of size n-16, what is the distribution of X? (20 pt.) Q3: In your own words, interpret the following probability
statement: P(X>20.26)=0.8084 (20 pt.) Q4: Find the following probability: P(z>0) for X (the sampling distribution) for Q1 above. (10 pt.) Q5: Confidence Intervals When constructing a confidence interval for the mean, what two different statistics would be considered and why? (10 pt.) Q6: The high temperatures for a day in late May for a random sample of U.S. cities are listed here. Use a calculator statistical function to estimate the mean population high temperature with 90% confidence. Assume the population is mound-shaped and symmetrical, and has no outliers. Round answer to 1 decimal place. Write out how you completed this problem using calculator functions. (20 pt.) 60 88 73 86 103 79 67 72 89 105 76 87