- The Cbcl Measures Children S Behavior Lower Scores Indicate Better Behavior The Mean Cbcl Score In The Population Is 1 (33.68 KiB) Viewed 80 times
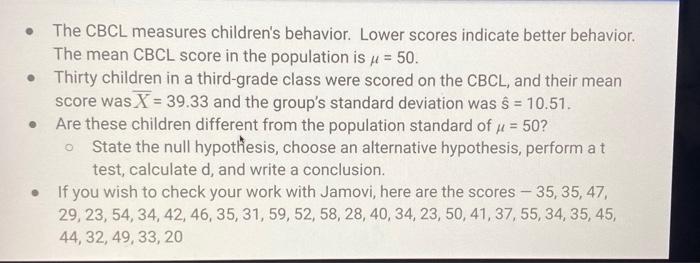
• The CBCL measures children's behavior. Lower scores indicate better behavior. The mean CBCL score in the population is μ = 50. • Thirty children in a third-grade class were scored on the CBCL, and their mean score was X = 39.33 and the group's standard deviation was ŝ = 10.51. Are these children different from the population standard of μ = 50? • o State the null hypothesis, choose an alternative hypothesis, perform a t test, calculate d, and write a conclusion. If you wish to check your work with Jamovi, here are the scores - 35, 35, 47, 29, 23, 54, 34, 42, 46, 35, 31, 59, 52, 58, 28, 40, 34, 23, 50, 41, 37, 55, 34, 35, 45, 44, 32, 49, 33, 20