- 9 For 15 Years A County Has Been Keeping Track Of Traffic Fatalities From The Total Number Of Fatal Traffic Accidents 1 (32.75 KiB) Viewed 34 times
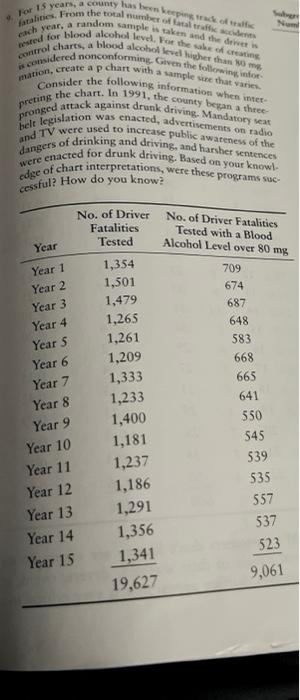
9. For 15 years, a county has been keeping track of traffic fatalities. From the total number of fatal traffic accidents each year, a random sample is taken and the driver is tested for blood alcohol level. For the sake of creating control charts, a blood alcohol level higher than 80 mg is considered nonconforming. Given the following infor- mation, create a p chart with a sample size that varies Consider the following information when inter- preting the chart. In 1991, the county began a three- pronged attack against drunk driving. Mandatory seat was enacted, advertisements on radio belt legislation and TV were used to increase public awareness of the dangers of drinking and driving, and harsher sentences were enacted for drunk driving. Based on your knowl edge of chart interpretations, were these programs suc- cessful? How do you know? Year Year 1 Year 2 Year 3 Year 4 Year 5 Year 6 Year 7 Year 8 Year 9 Year 10 Year 11 Year 12 Year 13 Year 14 Year 15 No. of Driver Fatalities Tested 1,354 1,501 1,479 1,265 1,261 1,209 1,333 1,233 1,400 1,181 1,237 1,186 1,291 1,356 1,341 19,627 No. of Driver Fatalities Tested with a Blood Alcohol Level over 80 mg 709 674 Subgro Num 687 648 583 668 665 641 550 545 539 535 557 537 523 9,061