Page 1 of 1
A statistics instructor wonders whether significant differences exist in her students' average exam scores in her three
Posted: Mon Jul 11, 2022 11:38 am
by answerhappygod
- A Statistics Instructor Wonders Whether Significant Differences Exist In Her Students Average Exam Scores In Her Three 1 (40.91 KiB) Viewed 25 times
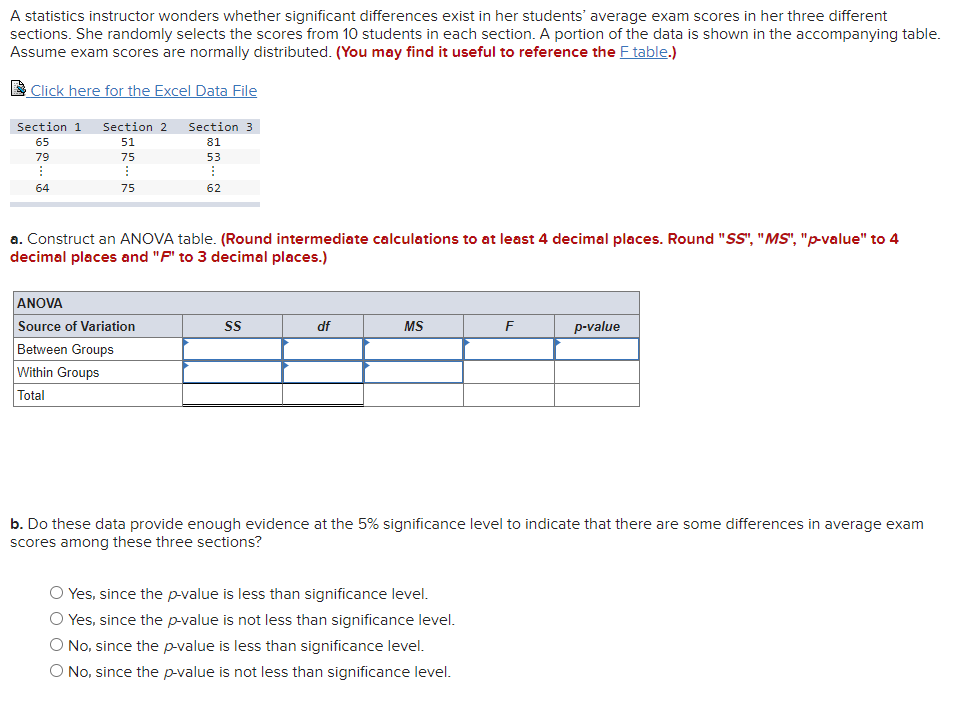
A statistics instructor wonders whether significant differences exist in her students' average exam scores in her three different sections. She randomly selects the scores from 10 students in each section. A portion of the data is shown in the accompanying table. Assume exam scores are normally distributed. (You may find it useful to reference the F table.) Click here for the Excel Data File Section 1 Section 2 Section 3 65 51 81 79 53 75 A I 64 75 62 a. Construct an ANOVA table. (Round intermediate calculations to at least 4 decimal places. Round "SS", "MS", "p-value" to 4 decimal places and "F" to 3 decimal places.) ANOVA Source of Variation Between Groups Within Groups Total SS df MS F O Yes, since the p-value is less than significance level. O Yes, since the p-value is not less than significance level. O No, since the p-value is less than significance level. O No, since the p-value is not less than significance level. p-value b. Do these data provide enough evidence at the 5% significance level to indicate that there are some differences in average exam scores among these three sections?
A B Section 1 Section 2 65 51 79 75 59 54 70 61 61 77 63 57 80 54 71 64 59 73 69 75 Section 3 81 53 50 58 61 52 90 68 55 62