Page 1 of 1
The graphs correspond to a hypothesis test for population mean u, where the population standard deviation o is known, μo
Posted: Mon Jul 11, 2022 11:38 am
by answerhappygod
- 1 (154.81 KiB) Viewed 22 times
- 2 (121.91 KiB) Viewed 22 times
- 3 (139.8 KiB) Viewed 22 times
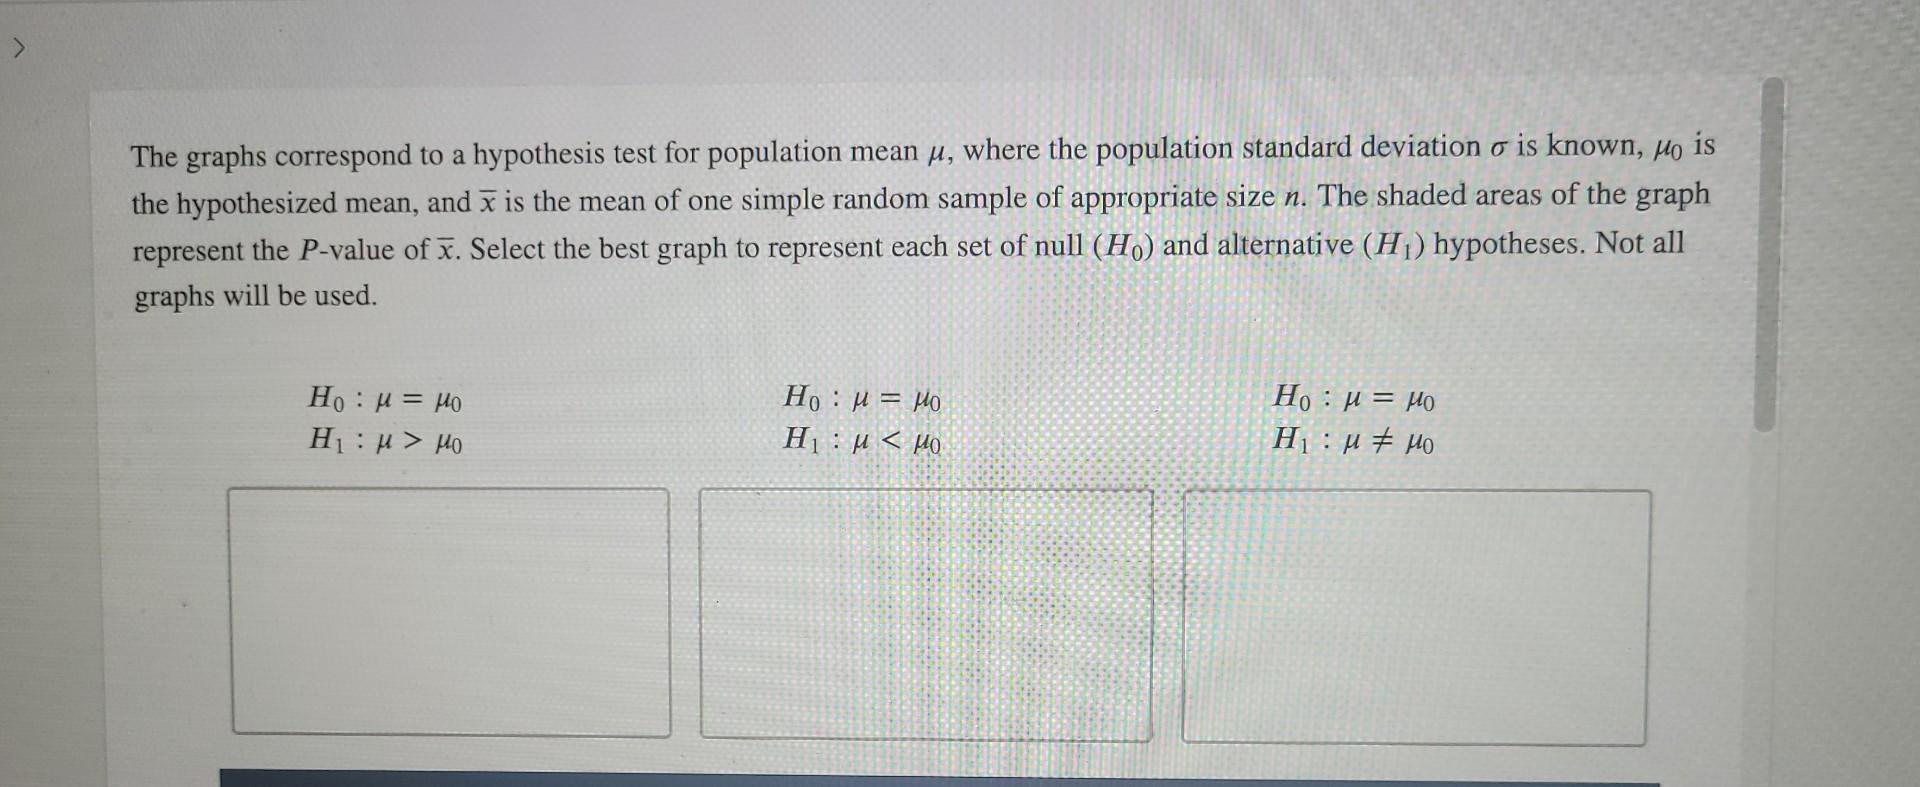
The graphs correspond to a hypothesis test for population mean u, where the population standard deviation o is known, μo is the hypothesized mean, and x is the mean of one simple random sample of appropriate size n. The shaded areas of the graph represent the P-value of x. Select the best graph to represent each set of null (Ho) and alternative (H₁) hypotheses. Not all graphs will be used. Ho: μ = Ho Η : μ > μο Ho : μ = μο Η : μ < μο Ho : H = Ho Η : μ # μο
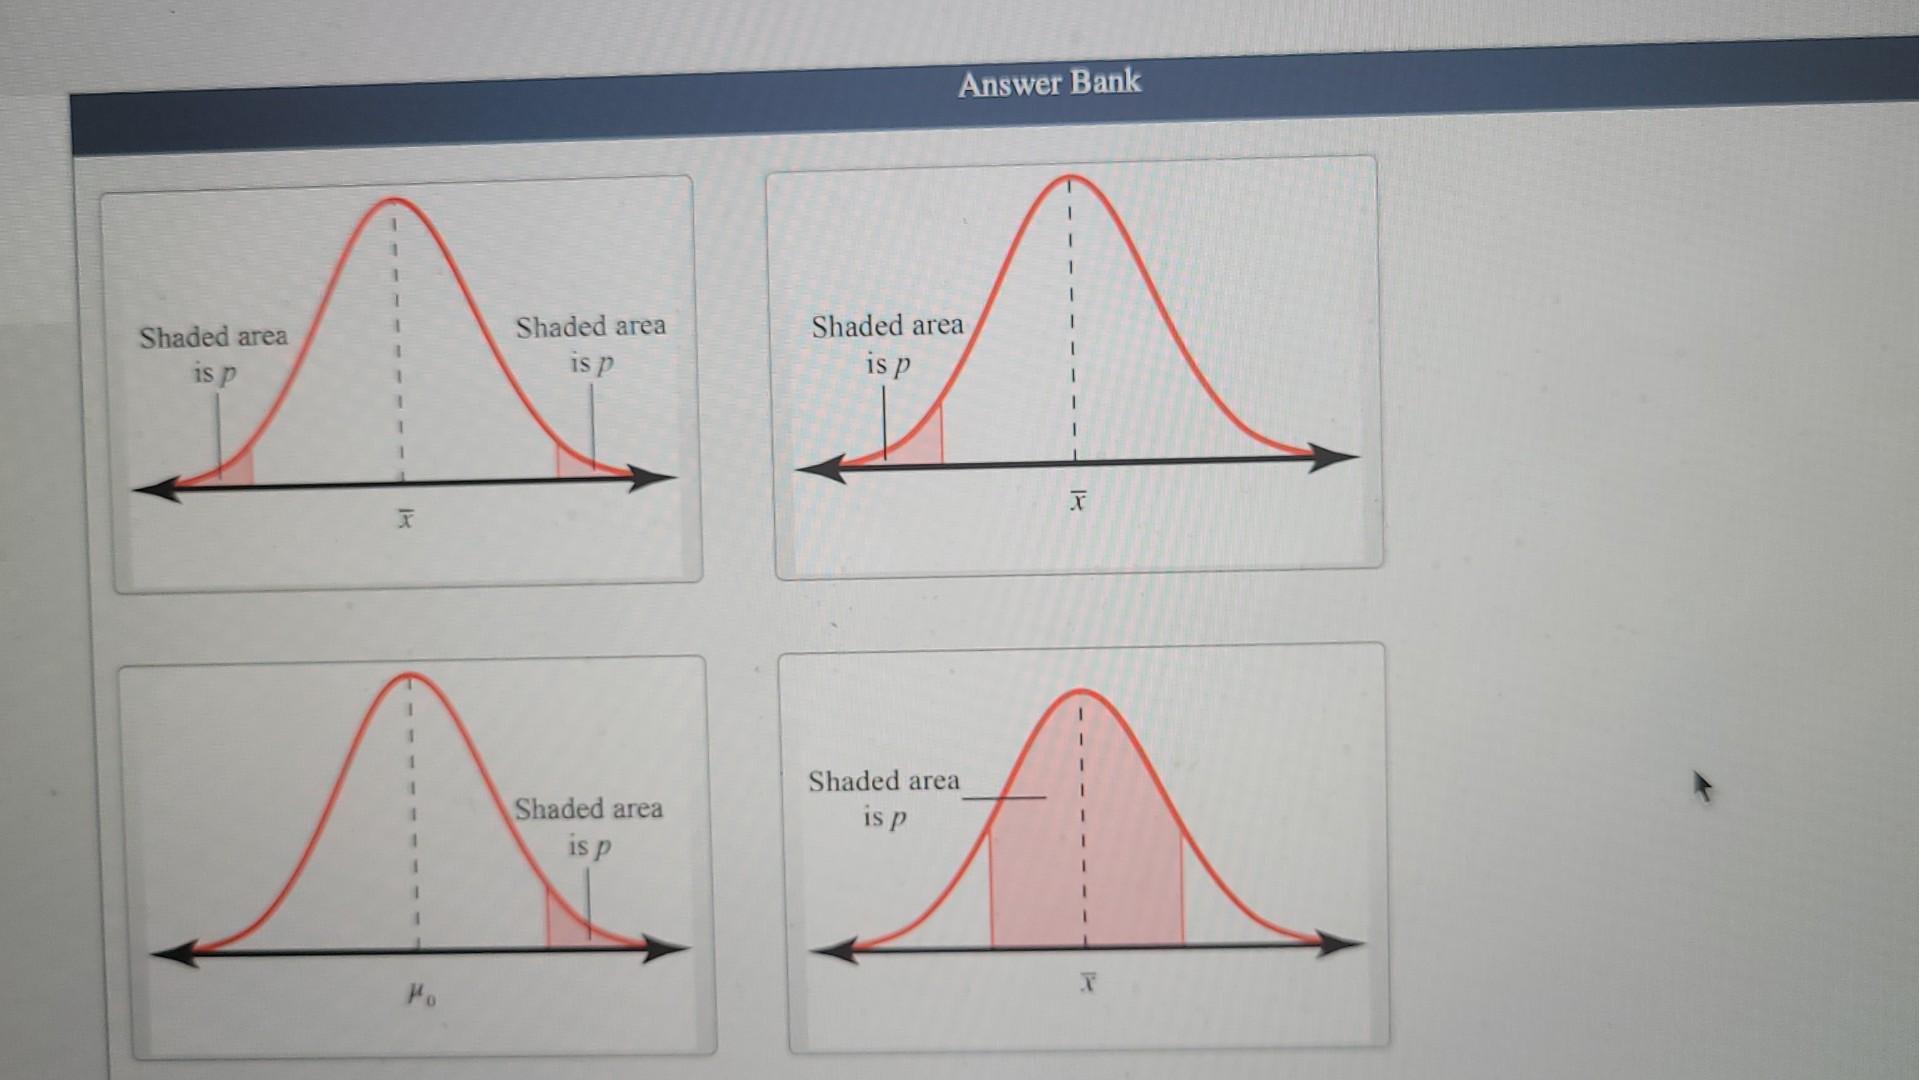
Shaded area is p 1 1 1 1 1 1 Mo Shaded area is p Shaded area is p Answer Bank Shaded area is p Shaded area is p X X
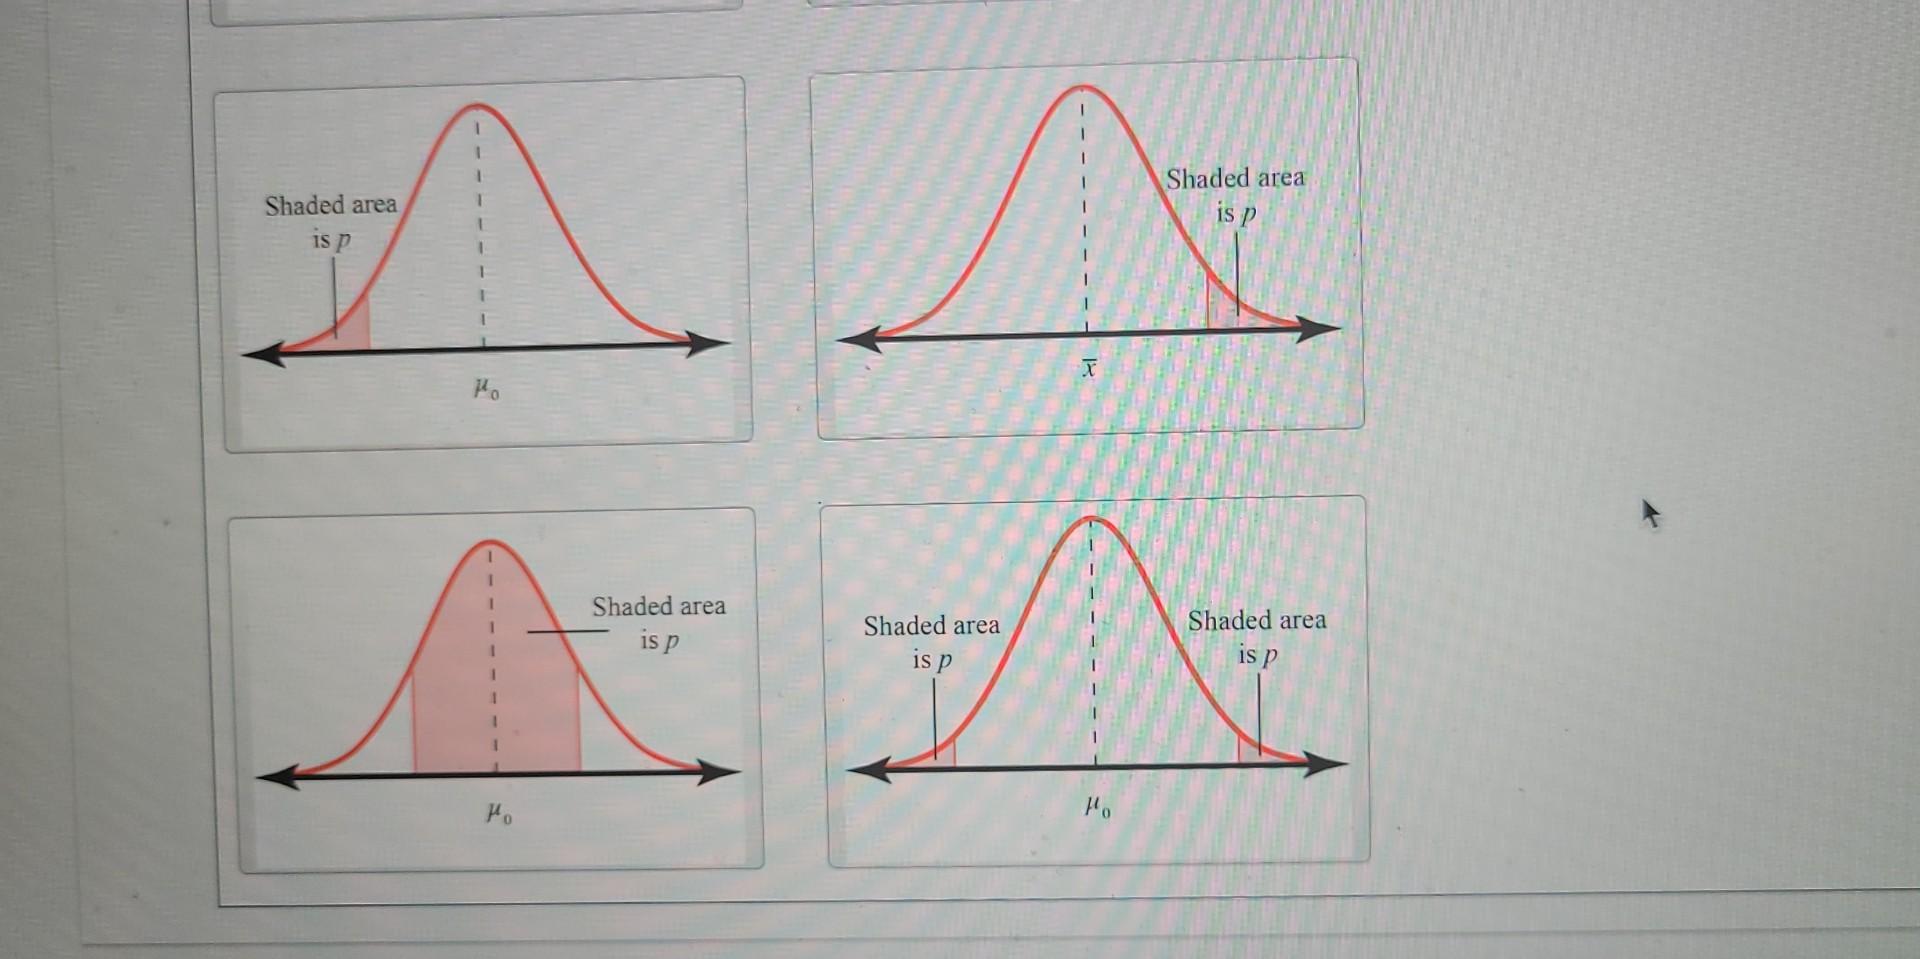
Shaded area is p Po I Ho Shaded area is p Shaded area is p X Ho Shaded area is p Shaded area is p