Page 1 of 1
The data in the following table are particulate emissions for 65 vehicles, in units of grams of particles per gallon of
Posted: Mon Jul 11, 2022 11:38 am
by answerhappygod
- The Data In The Following Table Are Particulate Emissions For 65 Vehicles In Units Of Grams Of Particles Per Gallon Of 1 (38.88 KiB) Viewed 19 times
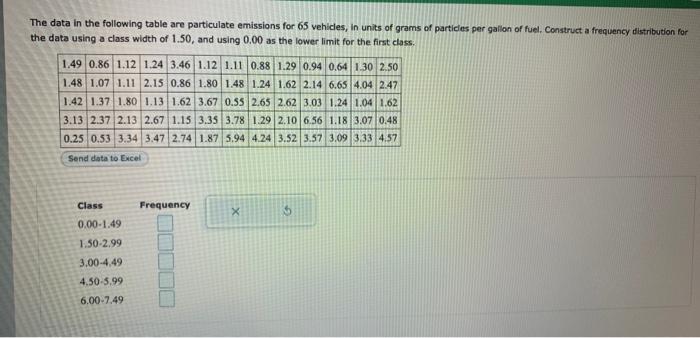
The data in the following table are particulate emissions for 65 vehicles, in units of grams of particles per gallon of fuel. Construct a frequency distribution for the data using a class width of 1.50, and using 0.00 as the lower limit for the first class. 1.49 0.86 1.12 1.24 3.46 1.12 1.11 0.88 1.29 0.94 0.64 1.30 2.50 1.48 1.07 1.11 2.15 0.86 1.80 1.48 1.24 1.62 2.14 6.65 4.04 2.47 1.42 1.37 1.80 1.13 1.62 3.67 0.55 2.65 2.62 3.03 1.24 1.04 1.62 3.13 2.37 2.13 2.67 1.15 3.35 3.78 1.29 2.10 6.56 1.18 3.07 0.48 0.25 0.53 3.34 3.47 2.74 1.87 5.94 4.24 3.52 3.57 3.09 3.33 4.57 Send data to Excel Class 0.00-1.49 1.50-2.99 3.00-4.49 4.50-5,99 6.00-7.49 Frequency X 16