Page 1 of 1
The following graph shows the approximate value of the United States Consumer Price Index (CPI) from December 2006 throu
Posted: Mon Jul 11, 2022 10:47 am
by answerhappygod
- The Following Graph Shows The Approximate Value Of The United States Consumer Price Index Cpi From December 2006 Throu 1 (51.13 KiB) Viewed 35 times
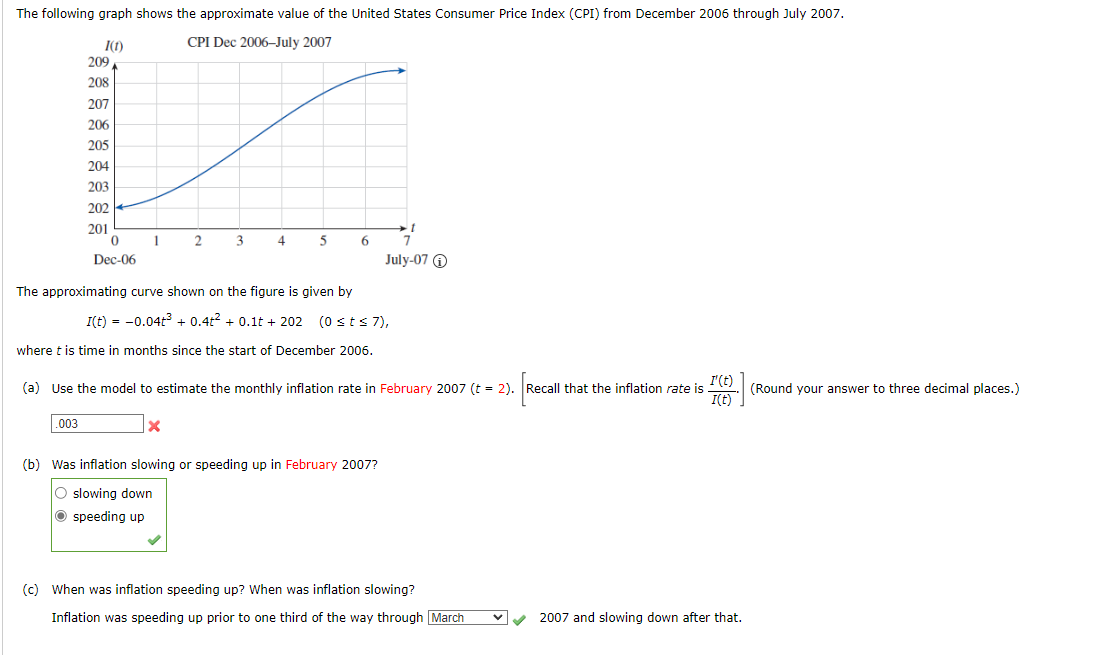
The following graph shows the approximate value of the United States Consumer Price Index (CPI) from December 2006 through July 2007. CPI Dec 2006-July 2007 1(1) 209 208 207 206 205 204 203 2024 201 003 0 Dec-06 1 2 3 4 The approximating curve shown on the figure is given by x 5 6 I(t) = -0.04t³ + 0.4² + 0.1t+202 (0 ≤ts 7), where t is time in months since the start of December 2006. I' (t) (a) Use the model to estimate the monthly inflation rate in February 2007 (t = 2). Recall that the inflation rate is I(t) 7 July-07 Ⓒ (b) Was inflation slowing or speeding up in February 2007? O slowing down ● speeding up (c) When was inflation speeding up? When was inflation slowing? Inflation was speeding up prior to one third of the way through March ✓ ✓ 2007 and slowing down after that. (Round your answer to three decimal places.)