Page 1 of 1
15. The following data was collected during a kinetics experiment: Time, s JAL 0 0.1000 0.0141 0.0078 0.0053 0.0040 5 10
Posted: Sun Jul 10, 2022 3:48 pm
by answerhappygod
- 15 The Following Data Was Collected During A Kinetics Experiment Time S Jal 0 0 1000 0 0141 0 0078 0 0053 0 0040 5 10 1 (32.76 KiB) Viewed 38 times
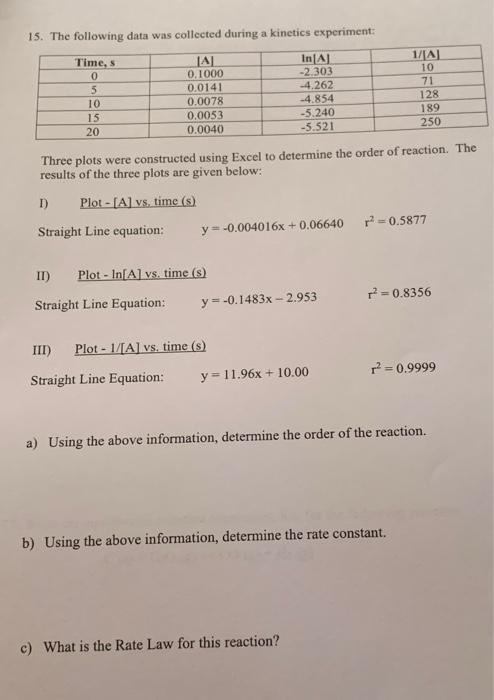
15. The following data was collected during a kinetics experiment: Time, s JAL 0 0.1000 0.0141 0.0078 0.0053 0.0040 5 10 15 20 In[A] -2.303 -4.262 -4.854 -5.240 -5.521 Three plots were constructed using Excel to determine the order of reaction. The results of the three plots are given below: I) Plot-[A] vs. time (s) Straight Line equation: y = -0.004016x +0.06640 II) Plot - In[A] vs. time (s) Straight Line Equation: y = -0.1483x-2.953 III) Plot-1/[A] vs. time (s) Straight Line Equation: y = 11.96x + 10.00 1/A 10 71 128 189 250 c) What is the Rate Law for this reaction? r² = 0.5877 2²=0.8356 r² = 0.9999 a) Using the above information, determine the order of the reaction. b) Using the above information, determine the rate constant.