- Phys 2142 Lab 7 Simple Harmonic Motion And Sine Function Virtual There Are Many Objects And Systems Which Exhibit S 1 (67.83 KiB) Viewed 73 times
PHYS 2142 Lab #7 - Simple Harmonic Motion and Sine Function [Virtual] There are many objects and systems which exhibit Simple Harmonic Motion (SHM). SEM is a periodic repetition of a pattern such as: the pendulum of a clock, a mass oscillating on a spring, a steel ball rolling up-and-down the wall of a curved bowl, a child swinging on a swing, and some electrical circuits (called oscillators) are just a few examples of SHM. So, why do scientists love SHM? To answer this
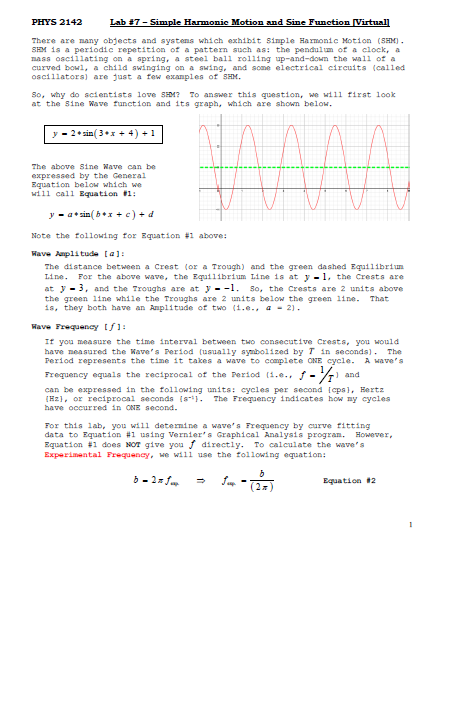
question, we will first look at the Sine Wave function and its graph, which are shown below. y = 2 + sin(3+x+4) +1 The above Sine Wave can be expressed by the General Equation below which we will call Equation #1: y asin(bx + c) + d Note the following for Equation #1 above: Wave Amplitude [4]: The distance between a Crest (or a Trough) and the green dashed Equilibrium Line. For the above wave, the Equilibrium Line is at y-1, the Crests are at y3, and the Troughs are at y=-1. So, the Crests are 2 units above the green line while the Troughs are 2 units below the green line. That is, they both have an Amplitude of two (1.e., a - 2). Wave Frequency 1/1: If you measure the time interval between two consecutive Crests, you would have measured the Wave's Period (usually symbolized by T in seconds). The Period represents the time it takes a wave to complete ONE cycle. A wave's Frequency equals the reciprocal of the Period (i.6., £-//7) -) and can be expressed in the following units: cycles per second [cps), Hertz (Hz), or reciprocal seconds (s). The Frequency indicates how my cycles have occurred in ONE second. For this lab, you will determine a wave's Frequency by curve fitting data to Equation #1 using Vernier's Graphical Analysis program. However, Equation #1 does NOT give you directly. To calculate the wave's Experimental Frequency, we will use the following equation: 6-27 1 => Ju b (2x Equation #2