Page 1 of 1
Question 3 The FIGURE 2 below shows the angular position versus time graph for a particle moving in a circle. 0 (rad) 4#
Posted: Sun Jul 10, 2022 11:52 am
by answerhappygod
- Question 3 The Figure 2 Below Shows The Angular Position Versus Time Graph For A Particle Moving In A Circle 0 Rad 4 1 (37.63 KiB) Viewed 48 times
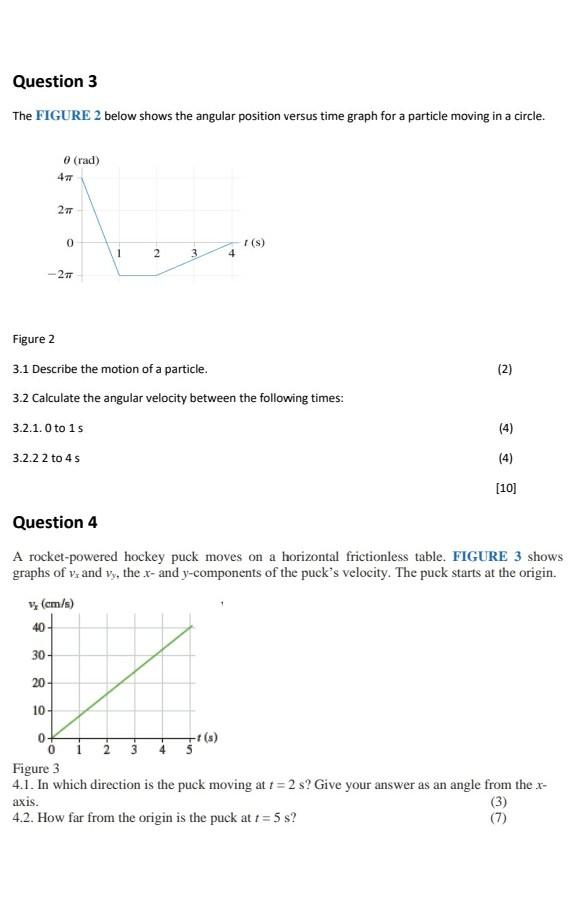
Question 3 The FIGURE 2 below shows the angular position versus time graph for a particle moving in a circle. 0 (rad) 4# 40 2T 0 0 -2T 1 2 3. Figure 2 3.1 Describe the motion of a particle. 3.2 Calculate the angular velocity between the following times: 3.2.1.0 to 1s 3.2.2 2 to 4 s 30- ✓ 20- 10- 4 T(S)
Question 4 A rocket-powered hockey puck moves on a horizontal frictionless table. FIGURE 3 shows graphs of v. and vy, the x- and y-components of the puck's velocity. The puck starts at the origin. v, (cm/s) (2) (4) (4) [10] Figure 3 4.1. In which direction is the puck moving at t=2 s? Give your answer as an angle from the x- axis. (3) 4.2. How far from the origin is the puck at t = 5 s? (7)