Page 1 of 1
A machine is supposed to be filling cans with 16 ounces of a food product. Each hour, a sample of four cans is tested. T
Posted: Sun Jul 10, 2022 10:52 am
by answerhappygod
- A Machine Is Supposed To Be Filling Cans With 16 Ounces Of A Food Product Each Hour A Sample Of Four Cans Is Tested T 1 (62.96 KiB) Viewed 92 times
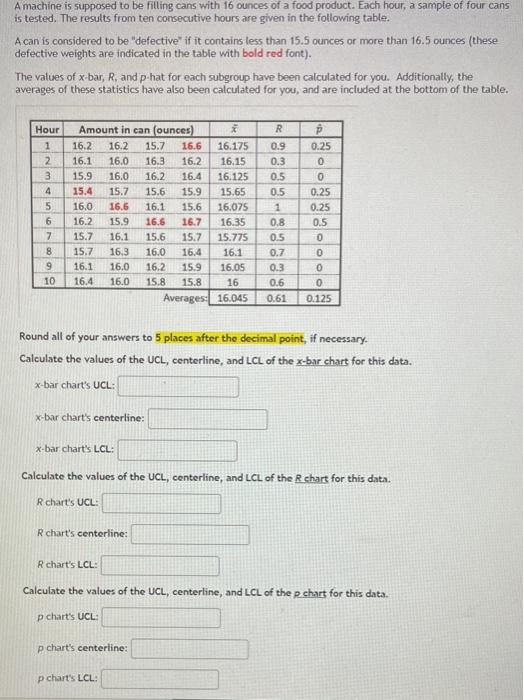
A machine is supposed to be filling cans with 16 ounces of a food product. Each hour, a sample of four cans is tested. The results from ten consecutive hours are given in the following table. A can is considered to be "defective" if it contains less than 15.5 ounces or more than 16.5 ounces (these defective weights are indicated in the table with bold red font). The values of x-bar, R, and p-hat for each subgroup have been calculated for you. Additionally, the averages of these statistics have also been calculated for you, and are included at the bottom of the table. Hour Amount in can (ounces) 1 16.2 16.2 2 66849SAWN 3 5 7 PE 10 ž R p 15.7 16.6 16.175 0.9 0.25 16.3 16.2 16.15 16.1 16.0 15.9 16.0 16.2 16.4 16.125 15.4 15.7 15.6 15.9 15.65 16.0 16.6 16.1 15.6 16.075 16.2 15.9 16.6 16.7 15.7 16.1 15.7 16.3 16.0 16.4 16.1 16.4 16.35 15.6 15.7 15.775 16.1 16.0 16.2 15.9 16.05 16.0 15.8 15.8 x-bar chart's UCL: x-bar chart's centerline: x-bar chart's LCL: R chart's UCL: R chart's centerline: R chart's LCL: 0.3 ddd p chart's centerline: p chart's LCL: 555 0.5 0.5 1 0.8 85 0.5 0.7 0.3 do Round all of your answers to 5 places after the decimal point, if necessary. Calculate the values of the UCL, centerline, and LCL of the x-bar chart for this data. 0.6 NO 0 0 Calculate the values of the UCL, centerline, and LCL of the R chart for this data. 0.25 0.25 0.5 3880000 16. Averages: 16.045 0.61 0.125 Calculate the values of the UCL, centerline, and LCL of the p chart for this data. p chart's UCL: