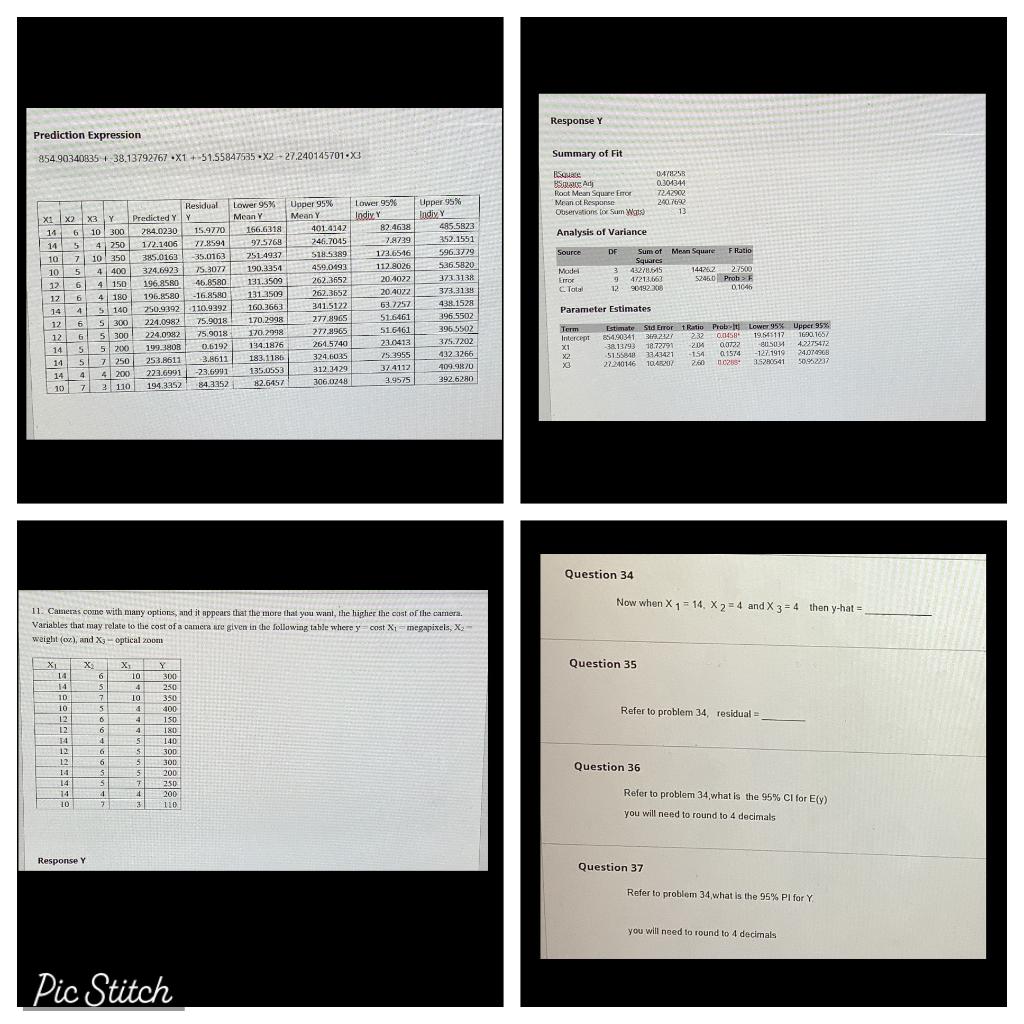
- Prediction Expression 854 90340835 38 13792767 X1 51 55847535 X227 240145701 X3 X1 X2 X3 Y 14 6 10 300 14 5 41 250 10 1 (137.43 KiB) Viewed 75 times
Prediction Expression 854.90340835+ 38.13792767 X1+-51.55847535 X227.240145701 X3 X1 X2 X3 Y 14 6 10 300. 14 5 41 250 10 7 10 350 10 5 4 400 12 6 4 150 12 4 180 14 5140 12 5 300 5 300 5 200 7 250 4 4 200 7 3 110 194.3357 12 14 14 14 10 X₁ 14 14 10 10 12 12 14 12 6 4 12 14 14 14 10 6 6 5 5 X₂ Response Y 6 5 7 5 11. Cameras come with many options, and it appears that the more that you want, the higher the cast of the camera. Variables that may relate to the cost of a camera are given in the following table where y cost X₁ megapixels, X₂- weight (oz), and X3-optical zoom 6 6 4 6 6 5 5 4 7 Predicted Y 284.0230 15.9770 77.8594 1/2.1406 385.0163 -35.0163 324,6923 75.3077 196.8580 46.8580 -16.8580 196.8580 250.9392 110.9392 75.9018 224.0982 224.0982 75.9018 0.6192 199.3808 3.8611 253.8611 223.6991 -23.6991 84.3352 X₂ 10 4 10. 4 4 4 5 5 5 5 T 4 Y 300 250 350 400 150 180 140 300 300 200 250 200 3 110 Residual Y Pic Stitch Lower 95% Mean Y 166.6318 97.5768 251-4937 190.3354 131.3509 131.3509 160.3663 170.2998 170.2998 134.1876 183.1186 135.0553 82.6457 Upper 95% Mean Y 401.4142 246.7045 518.5389 459.0493 262.3652 262.3652 341.5122 277.8965 277,8965 264.5740 324.6035 312.3429 306.0248 Lower 95% Y Indiv 82.4638 7.8739 173.6546 112.8026 20.4022 20.4022 63.7257 51.6461 51.6461 23.0413 75.3955 37.4112 3.9575 Upper 95% Indiy Y 485.5823 352.1551 596.3779 536.5820 373.3138 373.3138 438.1528 396.5502 396.5502 375.7202 432 3266 409.9870 392.6280 Response Y Summary of Fit Square Bare Ad Root Mean Square Error Mean of Response Observations for Sum Wats Analysis of Variance Source Model Error C Total DF Term Intercept X1 X2 X3 3 9 12 Parameter Estimates Sum of Mean Square F. Ratio Squares 43278.645 4/213,663 90492 308
Question 34 0478258 0304344 Estimate Std Error 1 Ratio Prob-It Lower 95% Upper 95% 369.2127 854.90341 2.32 0.0458 38.13/93 -204 18.72791 0,0722 01574 -1.54 51.55848 3343427 27240146 10,48207 2,60 0.0285 1690 1657 4.2275472 24.074968 50.952237
Question 35 7242902 240.7692 13
Question 36 144252 27500 52460 Prob>F 01046 Now when X 1 = 14, X 2=4 and X 3=4 then y-hat=
Question 37 19.545117 -805034 -127.1919 35280641 Refer to problem 34, residual = Refer to problem 34,what is the 95% CI for E(y) you will need to round to 4 decimals Refer to problem 34,what is the 95% Pl for Y you will need to round to 4 decimals