Page 1 of 1
You are performing a study about weekly per capita milk consumption. A previous study found weekly per capita milk consu
Posted: Sun Jul 10, 2022 10:50 am
by answerhappygod
- You Are Performing A Study About Weekly Per Capita Milk Consumption A Previous Study Found Weekly Per Capita Milk Consu 1 (38.82 KiB) Viewed 83 times
- You Are Performing A Study About Weekly Per Capita Milk Consumption A Previous Study Found Weekly Per Capita Milk Consu 2 (45.27 KiB) Viewed 83 times
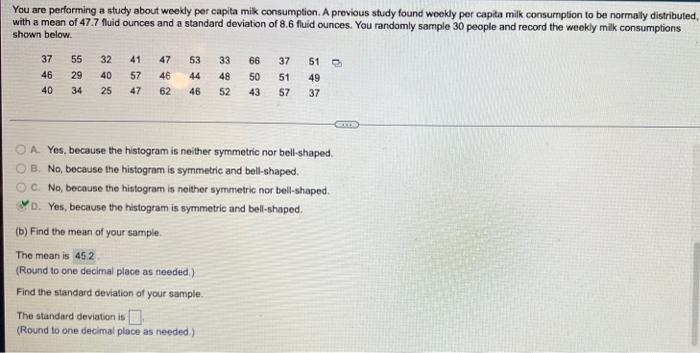
You are performing a study about weekly per capita milk consumption. A previous study found weekly per capita milk consumption to be normally distributed, with a mean of 47.7 fluid ounces and a standard deviation of 8.6 fluid ounces. You randomly sample 30 people and record the weekly milk consumptions shown below. 37 46 40 55 32 29 40 34 25 41 57 47 47 46 62 53 33 66 37 51 C 44 48 51 49 46 52 57 37 OA. Yes, because the histogram is neither symmetric nor bell-shaped. OB. No, because the histogram is symmetric and bell-shaped. 50 43 OC. No, because the histogram is neither symmetric nor bell-shaped. D. Yes, because the histogram is symmetric and bell-shaped. (b) Find the mean of your sample. The mean is 45.2 (Round to one decimal place as needed.). Find the standard deviation of your sample. The standard deviation is (Round to one decimal place as needed.)
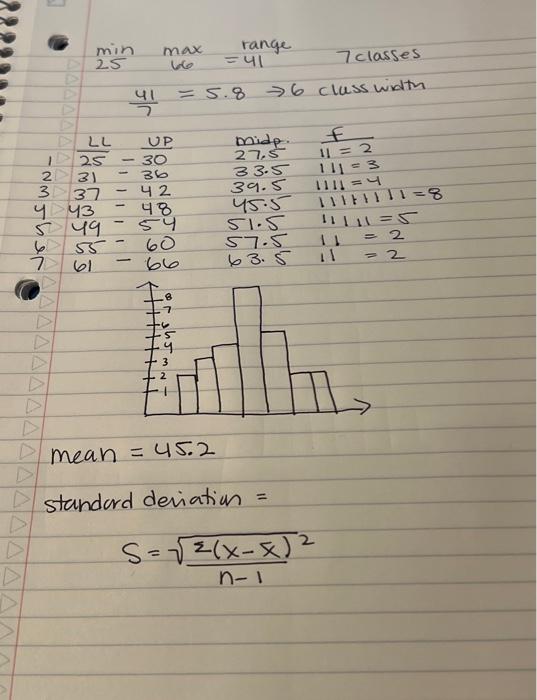
D 1 2 3 D D 6 7 min 25 443 549 LL UP 25 <-30 31 37 36 42 48 54 55-60 max 66 41 = 5.8 - 66 range =41 inst midp.. 27,5 33.5 39.5 45.5 51.5 57.5 63.5 mean = 452 standard deviation. 7classes 6 class width. = f 11 = 2 111=3 1111=4 2 S=√√²(x-x)² n-1 11|||||1=8 11111=5 = 2 = 2 il