Page 1 of 1
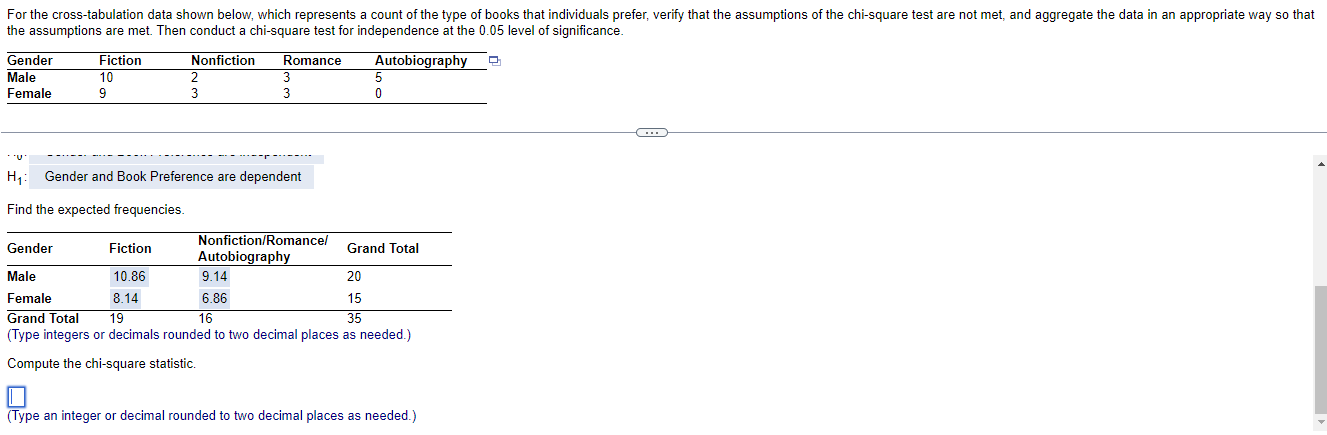
For the cross-tabulation data shown below, which represents a count of the type of books that individuals prefer, verify
Posted: Sun Jul 10, 2022 10:50 am
by answerhappygod
- For The Cross Tabulation Data Shown Below Which Represents A Count Of The Type Of Books That Individuals Prefer Verify 1 (26.34 KiB) Viewed 72 times
For the cross-tabulation data shown below, which represents a count of the type of books that individuals prefer, verify that the assumptions of the chi-square test are not met, and aggregate the data in an appropriate way so that the assumptions are met. Then conduct a chi-square test for independence at the 0.05 level of significance. Nonfiction Romance Autobiography Q Gender Male Female Fiction 10 9 2 3 Fiction 10.86 8.14 "U H₁: Gender and Book Preference are dependent Find the expected frequencies. 3 Nonfiction/Romance/ Autobiography 9.14 6.86 5 0 Gender Male 20 Female 15 Grand Total 19 16 35 (Type integers or decimals rounded to two decimal places as needed.) Compute the chi-square statistic. Grand Total (Type an integer or decimal rounded to two decimal places as needed.)