Page 1 of 1
1) The contour diagram below shows the horizontal range R (in m) of a projectile launched on level ground as a function
Posted: Sat Jul 09, 2022 2:21 pm
by answerhappygod
- 1 The Contour Diagram Below Shows The Horizontal Range R In M Of A Projectile Launched On Level Ground As A Function 1 (145.1 KiB) Viewed 56 times
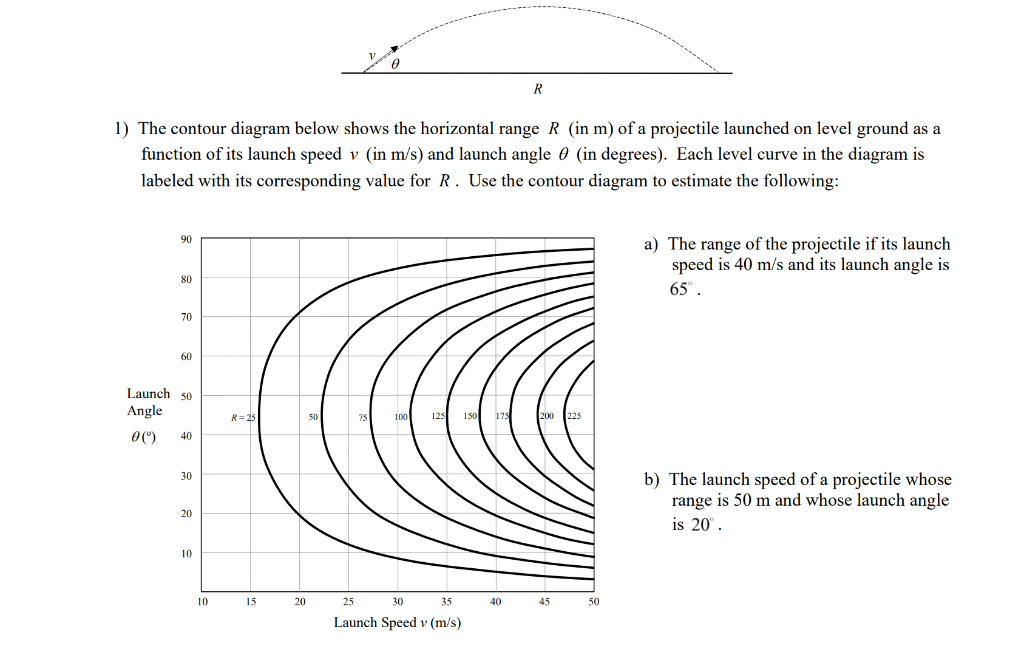
1) The contour diagram below shows the horizontal range R (in m) of a projectile launched on level ground as a function of its launch speed v (in m/s) and launch angle (in degrees). Each level curve in the diagram is labeled with its corresponding value for R. Use the contour diagram to estimate the following: 90 80 70 60 Launch 50 Angle 0 (0) 40 30 20 10 10 R = 25 15 20 25 30 35 Launch Speed v (m/s) 150 175 R 40 200 225 45 50 a) The range of the projectile if its launch speed is 40 m/s and its launch angle is 65⁰. b) The launch speed of a projectile whose range is 50 m and whose launch angle is 20⁰.