Page 1 of 1
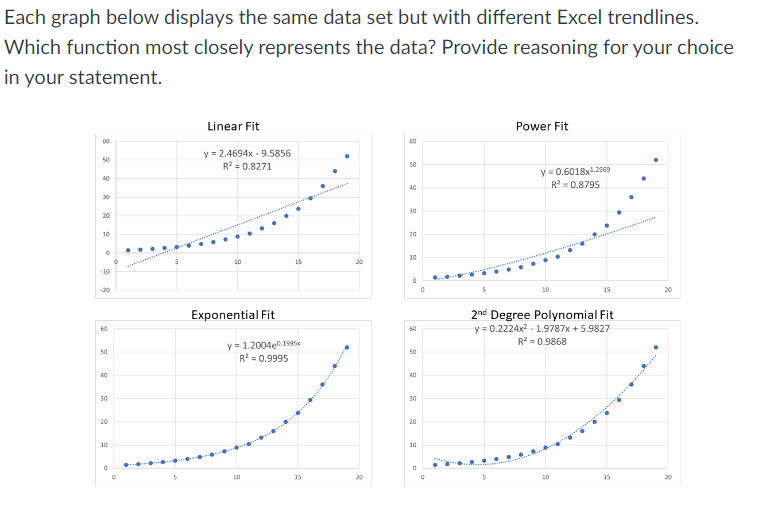
Each graph below displays the same data set but with different Excel trendlines. Which function most closely represents
Posted: Sat Jul 09, 2022 12:21 pm
by answerhappygod
- Each Graph Below Displays The Same Data Set But With Different Excel Trendlines Which Function Most Closely Represents 1 (54.37 KiB) Viewed 57 times
Each graph below displays the same data set but with different Excel trendlines. Which function most closely represents the data? Provide reasoning for your choice in your
statement. 8282 2 20 9 50 40 30 10 -10 60 50 40 30 20 10 0 0 C Linear Fit y = 2.4694x9.5856 R² = 0.8271 Exponential Fit 15 y=1.2004e0.1995 R² = 0.9995 20 15 20 20 60 50 40 30 20 10 0 60 50 40 30 20 10 0 0 C Power Fit y 0.6018x1.2969 R² = 0.8795 10 15 2nd Degree Polynomial Fit y=0.2224x² 1.9787x + 5.9827 R² = 0.9868 20 15 20 20