- Suppose You Have The Following Disposable Income And Consumption Data For A Country As Shown In The Table Below Dispos 1 (51.13 KiB) Viewed 31 times
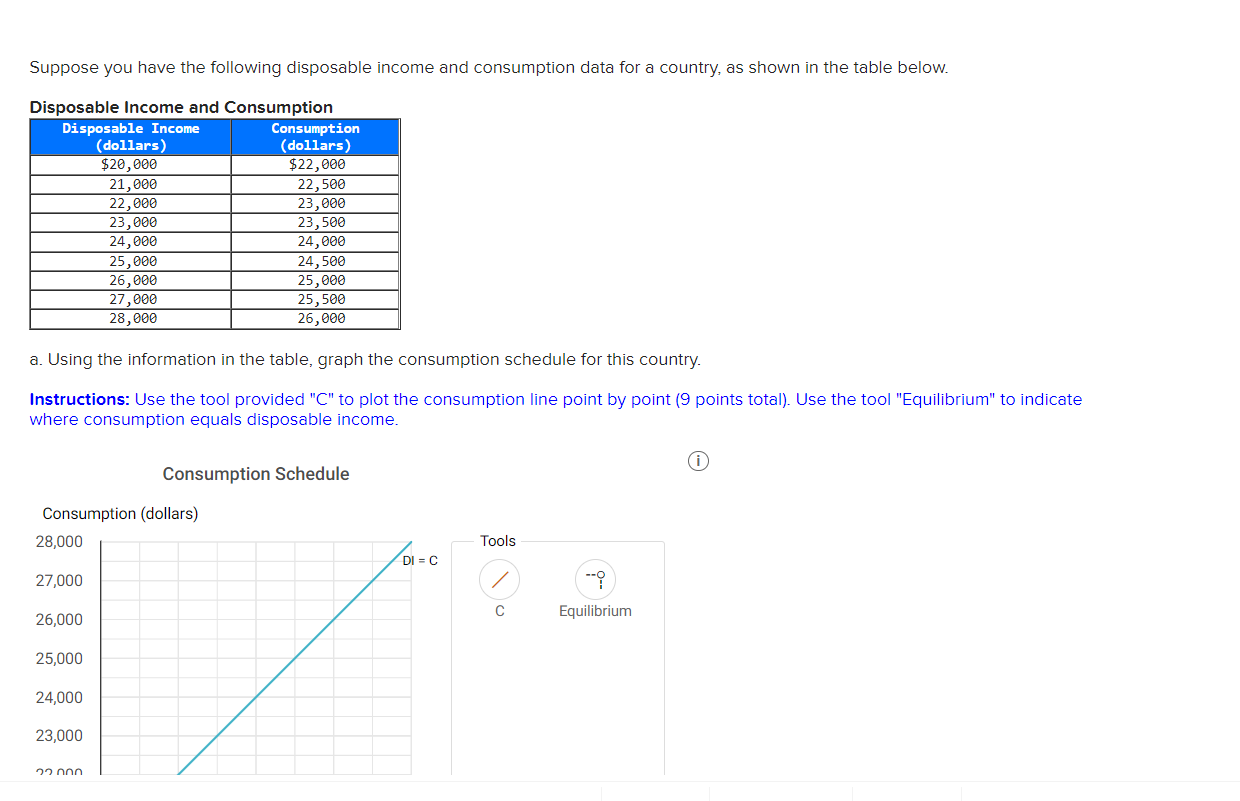
Suppose you have the following disposable income and consumption data for a country, as shown in the table below. Disposable Income and Consumption Disposable Income Consumption (dollars) (dollars) $20,000 $22,000 21,000 22,500 22,000 23,000 23,000 23,500 24,000 24,000 25,000 24,500 26,000 25,000 27,000 25,500 28,000 26,000 a. Using the information in the table, graph the consumption schedule for this country. Instructions: Use the tool provided "C" to plot the consumption line point by point (9 points total). Use the tool "Equilibrium" to indicate where consumption equals disposable income. Consumption Schedule Consumption (dollars) 28,000 Tools DI = C 27,000 -- Equilibrium С 26,000 25,000 24,000 23,000 ეეიიი