Page 1 of 1
5. The following table shows data from a uniaxial compression test on a cylindrical rock sample. Total axial load Sample
Posted: Fri Jul 08, 2022 5:52 am
by answerhappygod
- 5 The Following Table Shows Data From A Uniaxial Compression Test On A Cylindrical Rock Sample Total Axial Load Sample 1 (57.34 KiB) Viewed 42 times
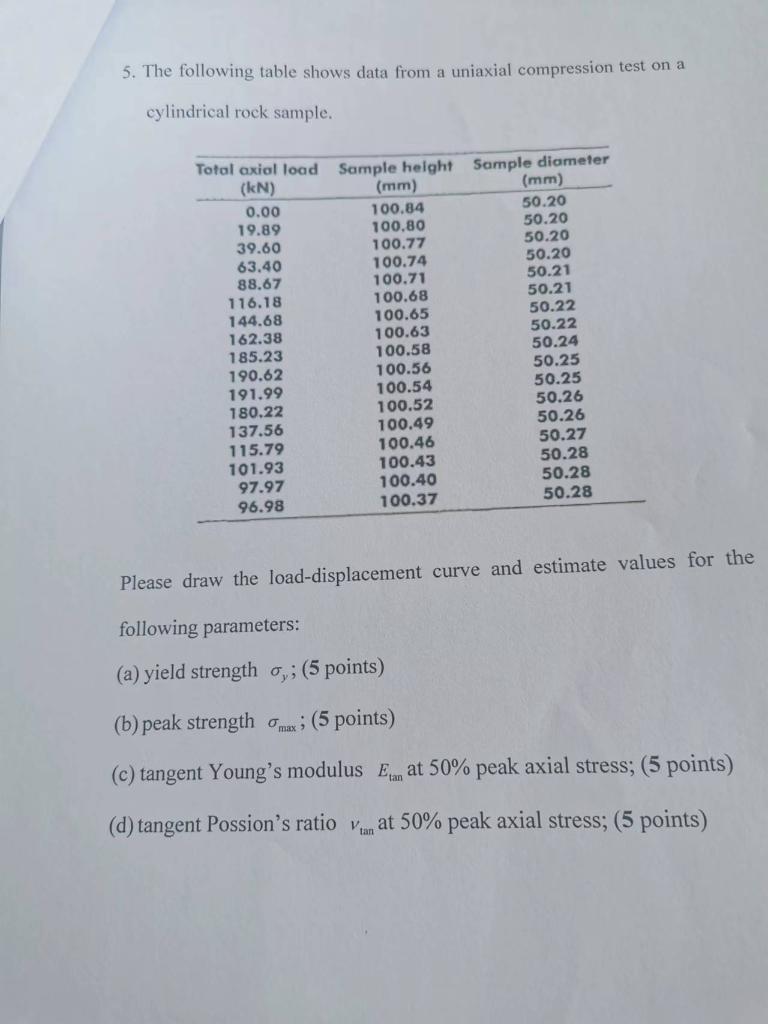
5. The following table shows data from a uniaxial compression test on a cylindrical rock sample. Total axial load Sample height Sample diameter (kN) 0.00 19.89 39.60 63.40 88.67 116.18 144.68 162.38 185.23 190.62 191.99 180.22 137.56 115.79 101.93 97.97 96.98 (mm) 100.84 100,80 100.77 100.74 100.71 100.68 100.65 100.63 100.58 100.56 100.54 100.52 100.49 100.46 100.43 100.40 100.37 (mm) 50.20 50.20 50.20 50.20 50.21 50.21 50.22 50.22 50.24 50.25 50.25 50.26 50.26 50.27 50.28 50.28 50.28 Please draw the load-displacement curve and estimate values for the following parameters: (a) yield strength o,; (5 points) (b) peak strength ; (5 points) (c) tangent Young's modulus Ean at 50% peak axial stress; (5 points) (d) tangent Possion's ratio van at 50% peak axial stress; (5 points)