Page 1 of 1
Macroeconomics is about more than just the models discussed in the textbook. JM Keynes wrote about the master economist:
Posted: Mon Apr 18, 2022 9:13 am
by answerhappygod
- Macroeconomics Is About More Than Just The Models Discussed In The Textbook Jm Keynes Wrote About The Master Economist 1 (103.34 KiB) Viewed 38 times
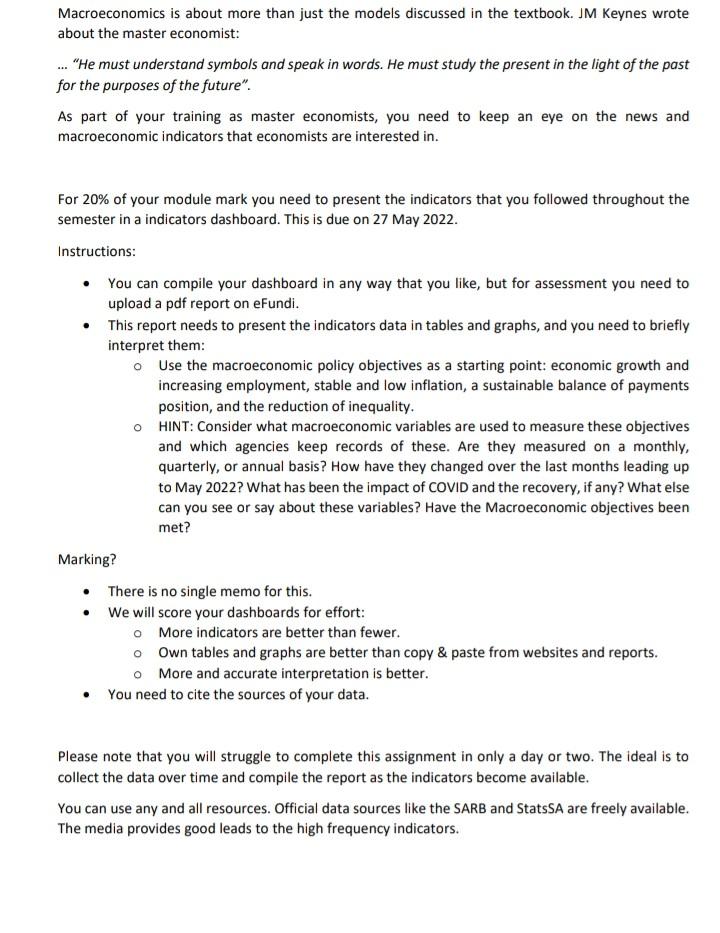
Macroeconomics is about more than just the models discussed in the textbook. JM Keynes wrote about the master economist: ... "He must understand symbols and speak in words. He must study the present in the light of the past for the purposes of the future". As part of your training as master economists, you need to keep an eye on the news and macroeconomic indicators that economists are interested in. For 20% of your module mark you need to present the indicators that you followed throughout the semester in a indicators dashboard. This is due on 27 May 2022. Instructions: • You can compile your dashboard in any way that you like, but for assessment you need to upload a pdf report on eFundi. • This report needs to present the indicators data in tables and graphs, and you need to briefly interpret them: o Use the macroeconomic policy objectives as a starting point: economic growth and increasing employment, stable and low inflation, a sustainable balance of payments position, and the reduction of inequality. HINT: Consider what macroeconomic variables are used to measure these objectives and which agencies keep records of these. Are they measured on a monthly, quarterly, or annual basis? How have they changed over the last months leading up to May 2022? What has been the impact of COVID and the recovery, if any? What else can you see or say about these variables? Have the Macroeconomic objectives been met? Marking? • There is no single memo for this. • We will score your dashboards for effort: o More indicators are better than fewer. o Own tables and graphs are better than copy & paste from websites and reports. o More and accurate interpretation is better. You need to cite the sources of your data. Please note that you will struggle to complete this assignment in only a day or two. The ideal is to collect the data over time and compile the report as the indicators become available. You can use any and all resources. Official data sources like the SARB and StatsSA are freely available. The media provides good leads to the high frequency indicators.