Page 1 of 1
The graph shows the top interviewer turnoffs and the percentage of surveyed interviewers who were offended by each of th
Posted: Fri Jul 08, 2022 5:37 am
by answerhappygod
- The Graph Shows The Top Interviewer Turnoffs And The Percentage Of Surveyed Interviewers Who Were Offended By Each Of Th 1 (45.98 KiB) Viewed 45 times
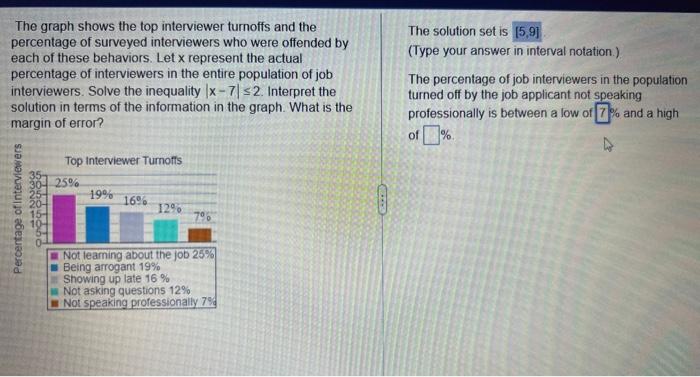
The graph shows the top interviewer turnoffs and the percentage of surveyed interviewers who were offended by each of these behaviors. Let x represent the actual percentage of interviewers in the entire population of job interviewers. Solve the inequality |x-7| ≤2. Interpret the solution in terms of the information in the graph. What is the margin of error? Percentage of Interviewers 35- NNOC PILIPI Top Interviewer Turnoffs 25% 19% 16% 12% 7% Not learning about the job 25% Being arrogant 19% Showing up late 16% Not asking
questions 12% Not speaking professionally 7% SEES The solution set is [5,9] (Type your answer in interval notation.) The percentage of job interviewers in the population turned off by the job applicant not speaking professionally is between a low of 7% and a high