Page 1 of 1
Price B ● D₂ A D₁ C Quantity Time left 5:34 The current price level and quantity demanded for a normal good is indicated
Posted: Wed Jul 06, 2022 6:34 pm
by answerhappygod
- Price B D A D C Quantity Time Left 5 34 The Current Price Level And Quantity Demanded For A Normal Good Is Indicated 1 (147.44 KiB) Viewed 30 times
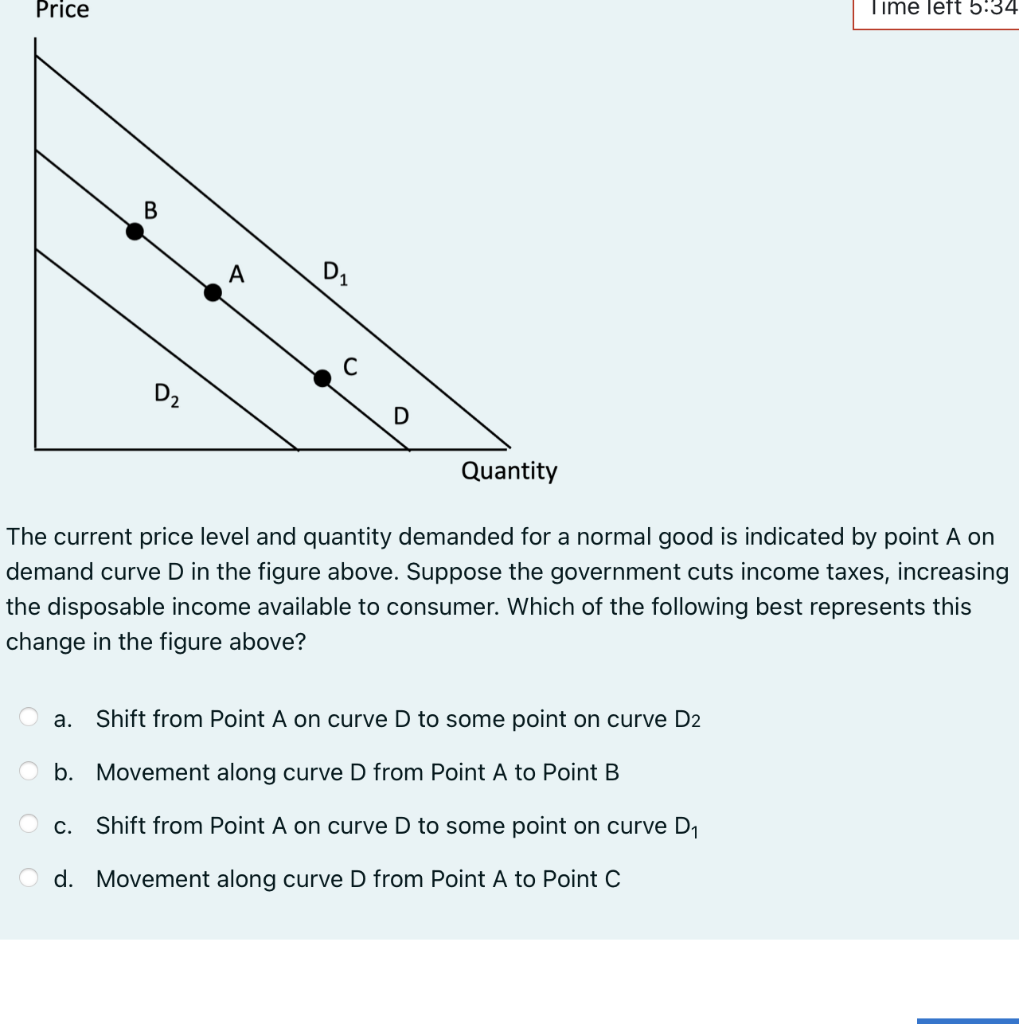
Price B ● D₂ A D₁ C Quantity Time left 5:34 The current price level and quantity demanded for a normal good is indicated by point A on demand curve D in the figure above. Suppose the government cuts income taxes, increasing the disposable income available to consumer. Which of the following best represents this change in the figure above? a. Shift from Point A on curve D to some point on curve D2 b. Movement along curve D from Point A to Point B O c. Shift from Point A on curve D to some point on curve D₁ O d. Movement along curve D from Point A to Point C