- The Data Below Shows The Sugar Content In Grams Of Several Brands Of Children S And Adults Cereals Create And Interpre 1 (61.19 KiB) Viewed 11 times
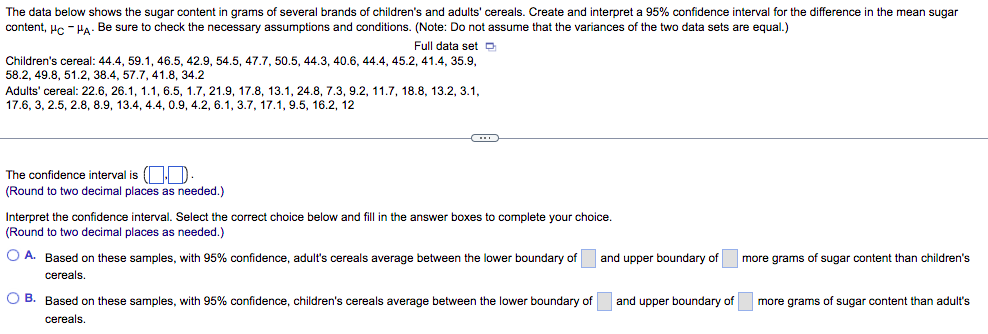
The data below shows the sugar content in grams of several brands of children's and adults' cereals. Create and interpret a 95% confidence interval for the difference in the mean sugar content, HC-HA- Be sure to check the necessary assumptions and conditions. (Note: Do not assume that the variances of the two data sets are equal.) Full data set Children's cereal: 44.4, 59.1, 46.5, 42.9, 54.5, 47.7, 50.5, 44.3, 40.6, 44.4, 45.2, 41.4, 35.9, 58.2, 49.8, 51.2, 38.4, 57.7, 41.8, 34.2 Adults' cereal: 22.6, 26.1, 1.1, 6.5, 1.7, 21.9, 17.8, 13.1, 24.8, 7.3, 9.2, 11.7, 18.8, 13.2, 3.1, 17.6, 3, 2.5, 2.8, 8.9, 13.4, 4.4, 0.9, 4.2, 6.1, 3.7, 17.1, 9.5, 16.2, 12 The confidence interval is (.. (Round to two decimal places as needed.) (**) Interpret the confidence interval. Select the correct choice below and fill in the answer boxes to complete your choice. (Round to two decimal places as needed.) O A. Based on these samples, with 95% confidence, adult's cereals average between the lower boundary of cereals. O B. Based on these samples, with 95% confidence, children's cereals average between the lower boundary of cereals. and upper boundary of and upper boundary of more grams of sugar content than children's more grams of sugar content than adult's