Page 1 of 1
SUMMARY OUTPUT Regression Statistics Multiple R R Square Adjusted R Square Standard Error Observations ANOVA Regression
Posted: Wed Jul 06, 2022 12:16 pm
by answerhappygod
- Summary Output Regression Statistics Multiple R R Square Adjusted R Square Standard Error Observations Anova Regression 1 (220.51 KiB) Viewed 8 times
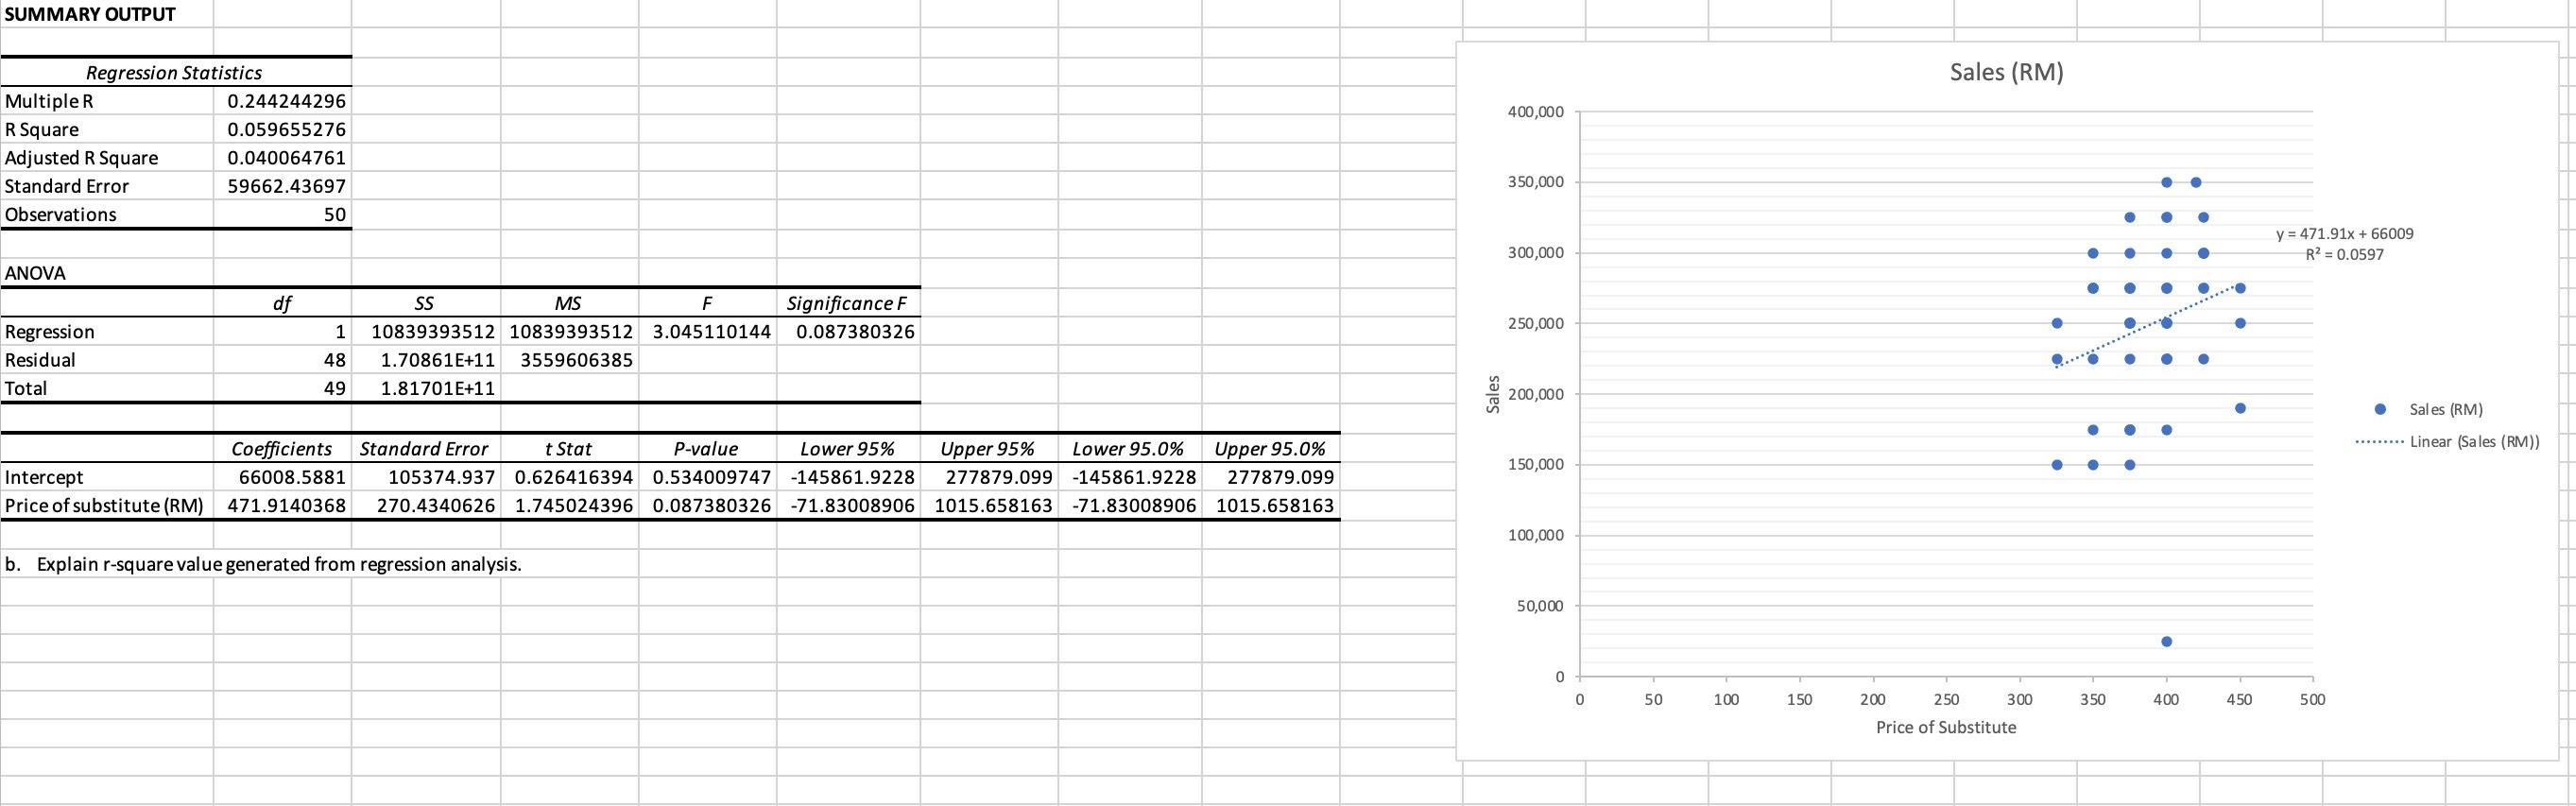
SUMMARY OUTPUT Regression Statistics Multiple R R Square Adjusted R Square Standard Error Observations ANOVA Regression Residual Total 0.244244296 0.059655276 0.040064761 59662.43697 df 50 1 48 49 SS MS F 10839393512 10839393512 3.045110144 1.70861E+11 3559606385 1.81701E+11 Significance F 0.087380326 Coefficients Standard Error t Stat P-value Lower 95% Upper 95% Lower 95.0% Intercept 66008.5881 105374.937 0.626416394 0.534009747 -145861.9228 277879.099 -145861.9228 Price of substitute (RM) 471.9140368 270.4340626 1.745024396 0.087380326 -71.83008906 1015.658163 -71.83008906 1015.658163 Upper 95.0% 277879.099 b. Explain r-square value generated from regression analysis. Sales 400,000 350,000 300,000 250,000 200,000 150,000 100,000 50,000 0 0 50 100 150 200 Sales (RM) 300 250 Price of Substitute 350 400 450 y = 471.91x + 66009 R² = 0.0597 500 Sales (RM) ......... Linear (Sales (RM))