Page 1 of 1
SUMMARY OUTPUT Multiple R R Square Adjusted R Square Standard Error Observations ANOVA Regression Residual Total Regress
Posted: Wed Jul 06, 2022 12:16 pm
by answerhappygod
- Summary Output Multiple R R Square Adjusted R Square Standard Error Observations Anova Regression Residual Total Regress 1 (253.36 KiB) Viewed 8 times
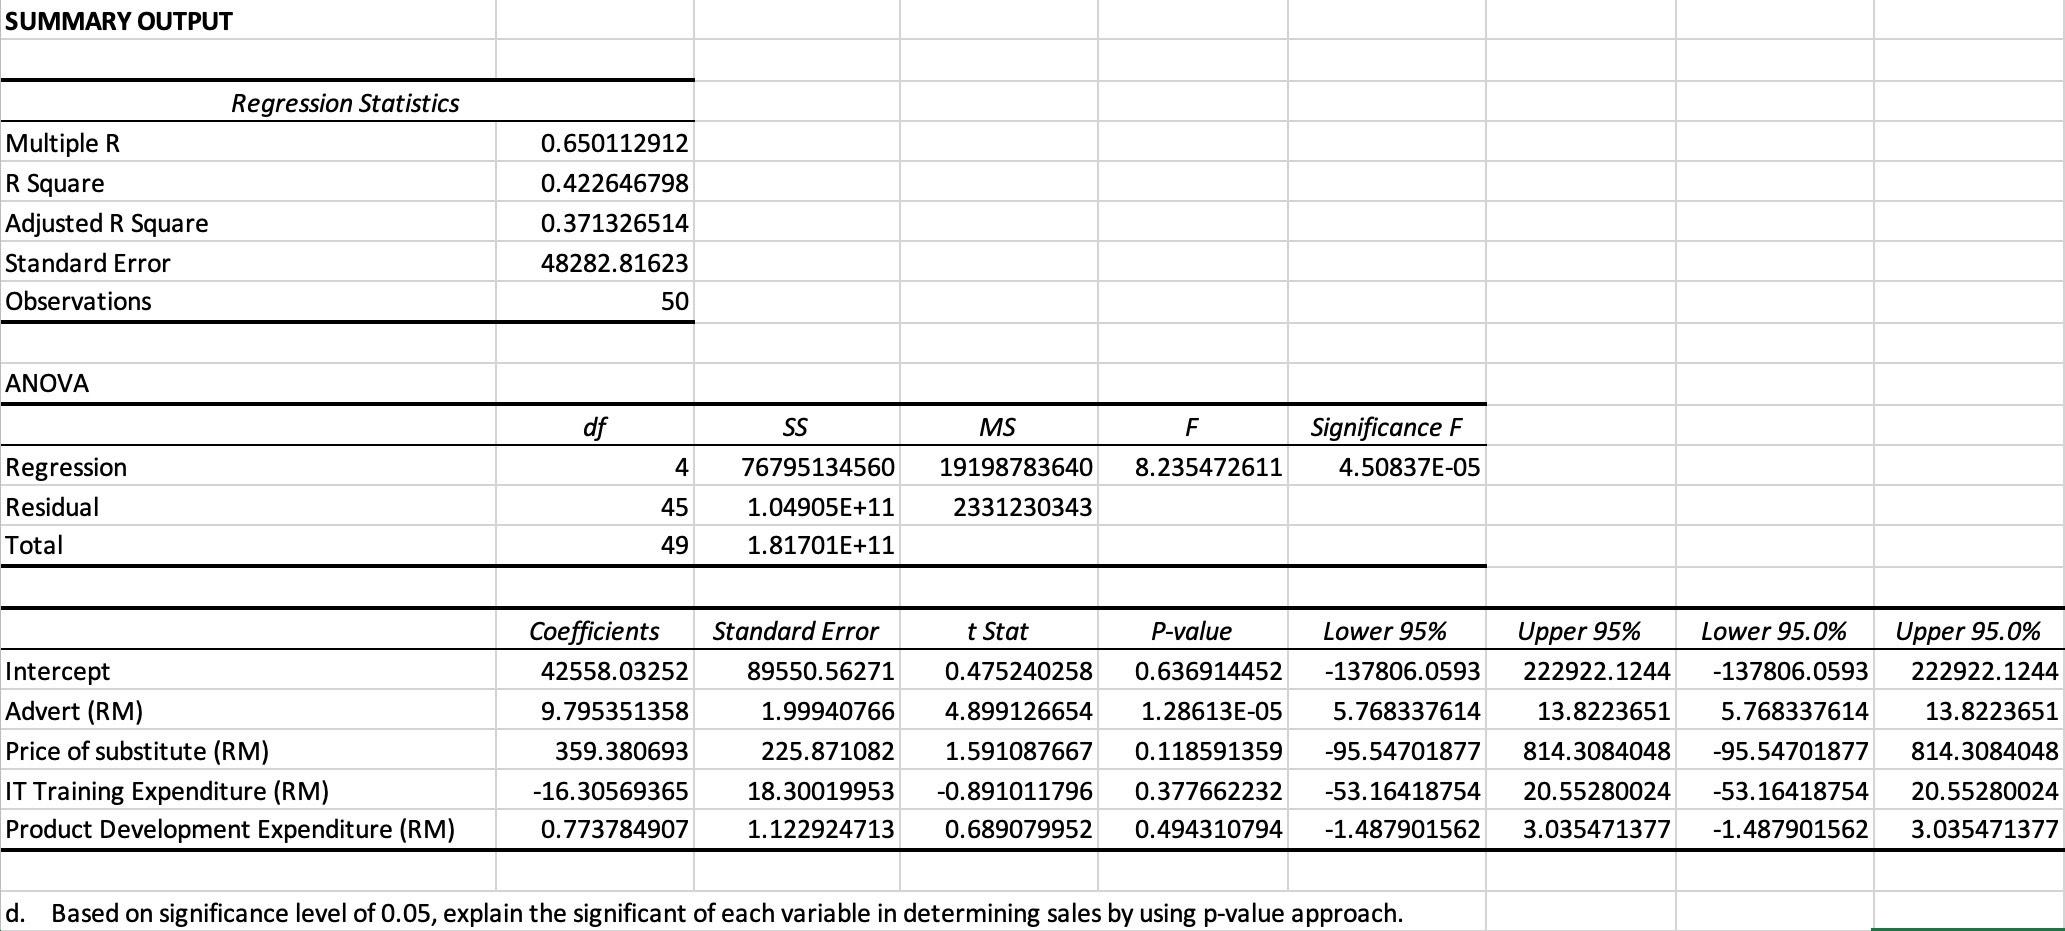
SUMMARY OUTPUT Multiple R R Square Adjusted R Square Standard Error Observations ANOVA Regression Residual Total Regression Statistics Intercept Advert (RM) Price of substitute (RM) IT Training Expenditure (RM) Product Development Expenditure (RM) 0.650112912 0.422646798 0.371326514 48282.81623 df 50 4 45 49 SS 76795134560 1.04905E+11 1.81701E+11 MS 19198783640 2331230343 F 8.235472611 Significance F 4.50837E-05 P-value Lower 95.0% 222922.1244 13.8223651 Coefficients Standard Error t Stat Lower 95% Upper 95% 42558.03252 89550.56271 0.475240258 0.636914452 -137806.0593 222922.1244 -137806.0593 9.795351358 1.99940766 4.899126654 1.28613E-05 5.768337614 13.8223651 5.768337614 359.380693 225.871082 1.591087667 0.118591359 -95.54701877 814.3084048 -95.54701877 814.3084048 -16.30569365 18.30019953 -0.891011796 0.377662232 -53.16418754 20.55280024 -53.16418754 20.55280024 0.773784907 1.122924713 0.689079952 0.494310794 -1.487901562 3.035471377 -1.487901562 3.035471377 d. Based on significance level of 0.05, explain the significant of each variable in determining sales by using p-value approach. Upper 95.0%