Page 1 of 1
By default, the standard normal distribution is displayed with mean μ = 0 and standard deviation o = 1. Change the mean
Posted: Wed Jul 06, 2022 12:16 pm
by answerhappygod
- 1 (416.69 KiB) Viewed 7 times
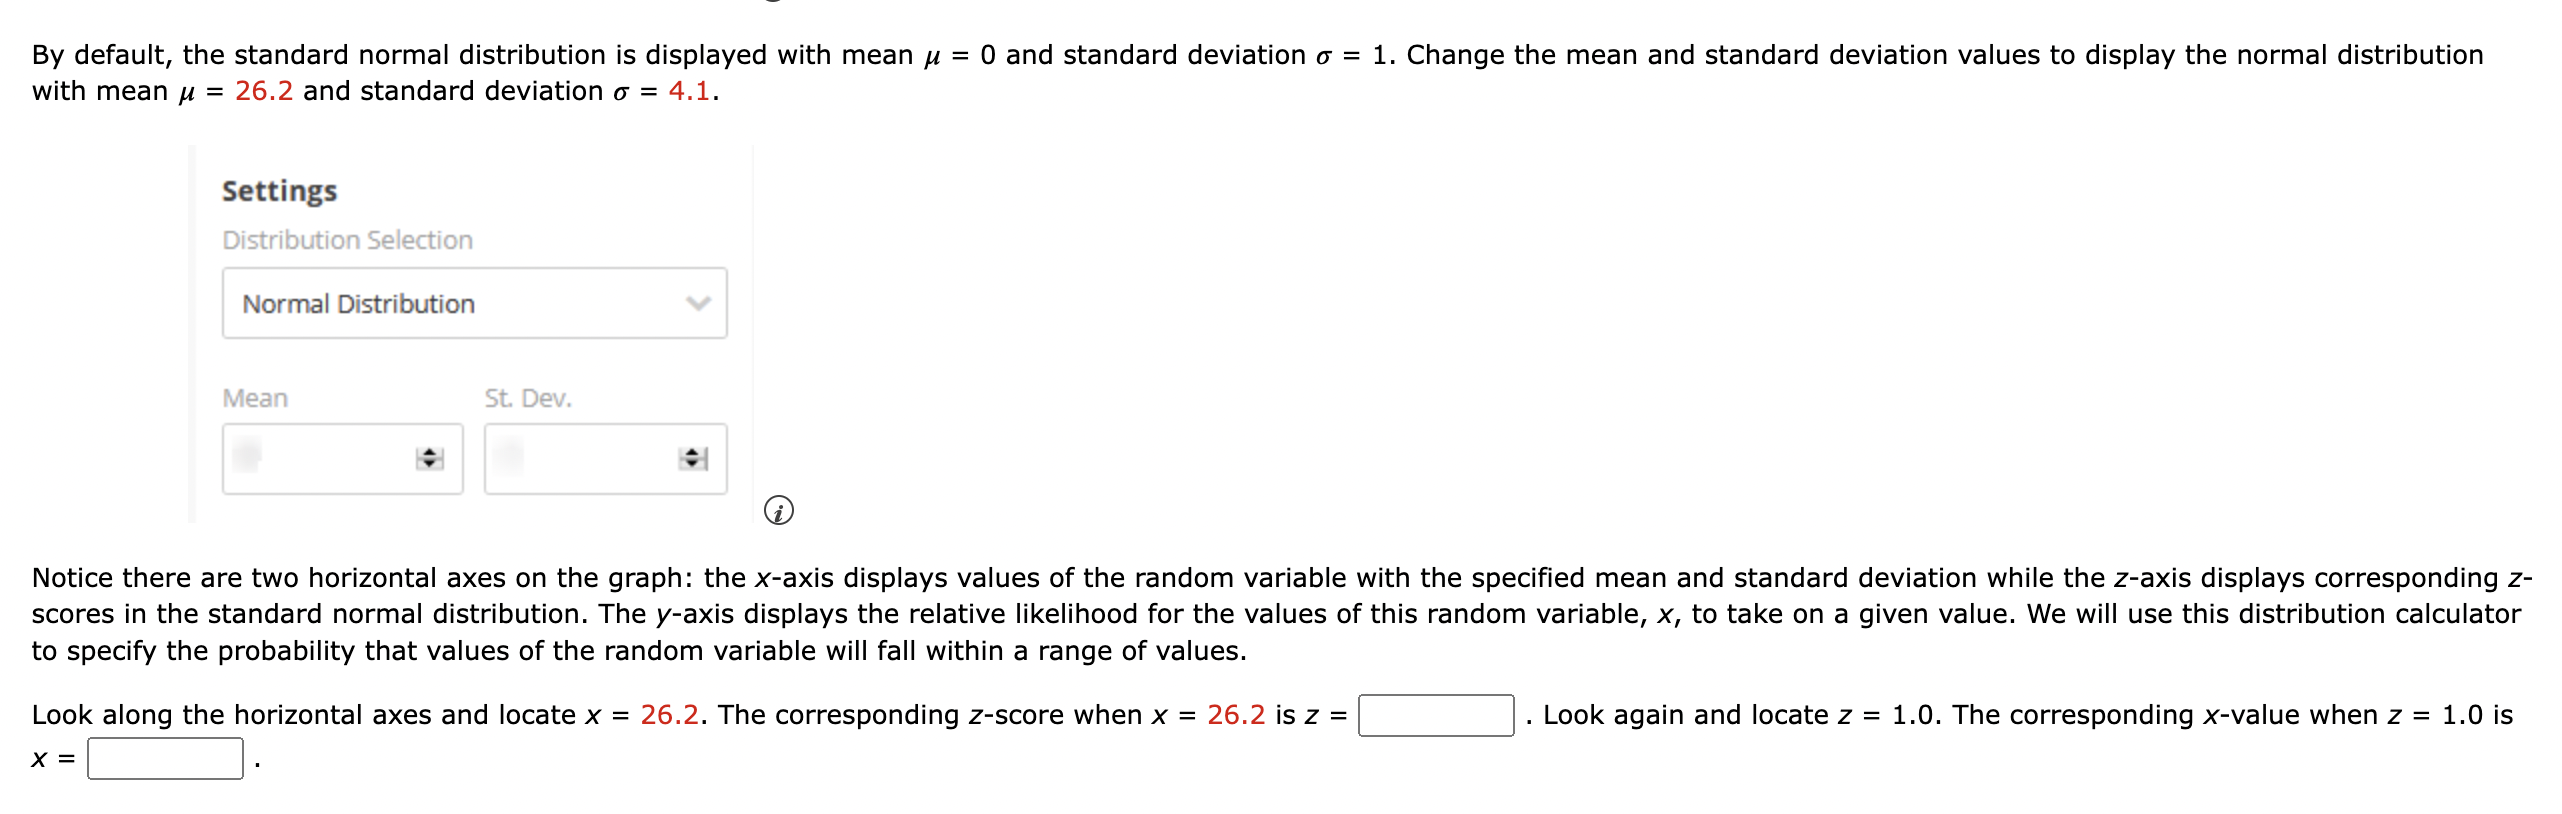
By default, the standard normal distribution is displayed with mean μ = 0 and standard deviation o = 1. Change the mean and standard deviation values to display the normal distribution with mean μ = 26.2 and standard deviation o = 4.1. Settings Distribution Selection Normal Distribution Mean St. Dev. Notice there are two horizontal axes on the graph: the x-axis displays values of the random variable with the specified mean and standard deviation while the z-axis displays corresponding z- scores in the standard normal distribution. The y-axis displays the relative likelihood for the values of this random variable, x, to take on a given value. We will use this distribution calculator to specify the probability that values of the random variable will fall within a range of values. Look along the horizontal axes and locate x = 26.2. The corresponding z-score when x = 26.2 is z = X = Look again and locate z = 1.0. The corresponding x-value when z = 1.0 is
f(x) 0.09 - 0.08 0.07- 0.06 0.05 0.04 0.03 0.02 T 0.01 9.80 │ -4.00 13.90 T -3.00 18.00 -2.00 22.10 T -1.00 26.20 0.00 30.30 T 1.00 34.40 T 2.00 38.50 3.00 X N