- Test The Following Hypotheses By Using The X Goodness Of Fit Test Ho Pa 0 40 Pb 0 40 And P 0 20 H The Popul 1 (52.79 KiB) Viewed 9 times
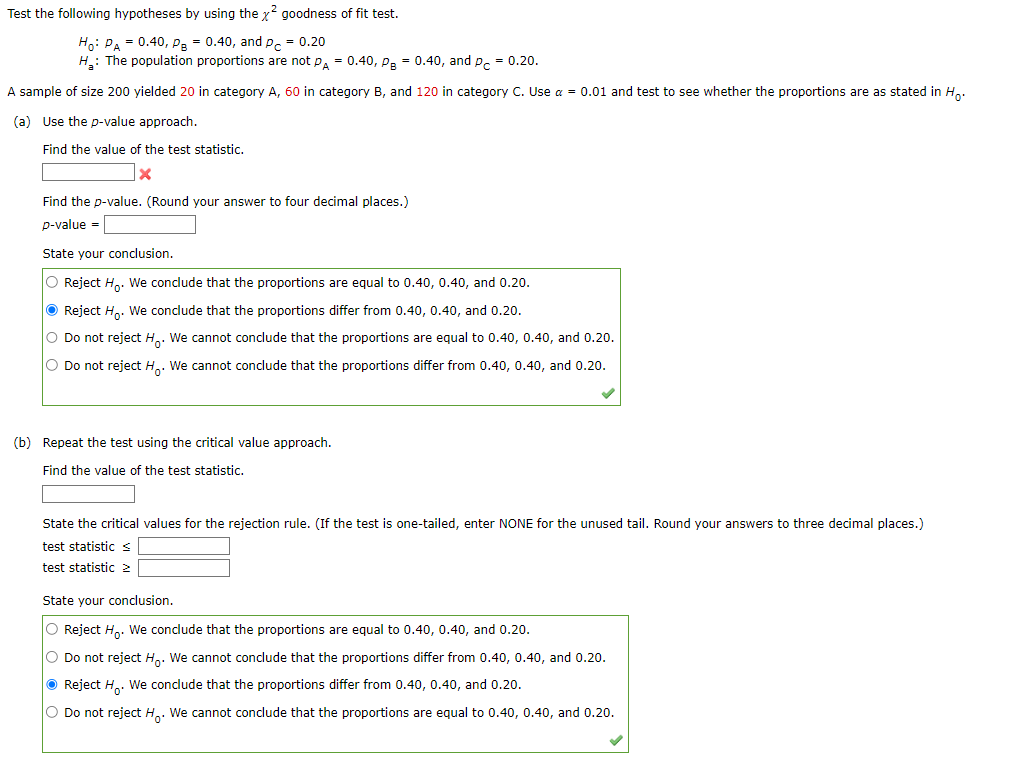
Test the following hypotheses by using the x² goodness of fit test. Ho: PA = 0.40, PB = 0.40, and p = 0.20 H₂: The population proportions are not PA = 0.40, PB = 0.40, and p = 0.20. A sample of size 200 yielded 20 in category A, 60 in category B, and 120 in category C. Use α = 0.01 and test to see whether the proportions are as stated in Ho. (a) Use the p-value approach. Find the value of the test statistic. X Find the p-value. (Round your answer to four decimal places.) p-value = State your conclusion. O Reject Ho. We conclude that the proportions are equal to 0.40, 0.40, and 0.20. Ⓒ Reject Ho. We conclude that the proportions differ from 0.40, 0.40, and 0.20. O Do not reject H. We cannot conclude that the proportions are equal to 0.40, 0.40, and 0.20. O Do not reject H. We cannot conclude that the proportions differ from 0.40, 0.40, and 0.20. (b) Repeat the test using the critical value approach. Find the value of the test statistic. State the critical values for the rejection rule. (If the test is one-tailed, enter NONE for the unused tail. Round your answers to three decimal places.) test statistics test statistic 2 State your conclusion. O Reject Ho. We conclude that the proportions are equal to 0.40, 0.40, and 0.20. O Do not reject Ho. We cannot conclude that the proportions differ from 0.40, 0.40, and 0.20. ● Reject H. We conclude that the proportions differ from 0.40, 0.40, and 0.20. O Do not reject H. We cannot conclude that the proportions are equal to 0.40, 0.40, and 0.20.