Page 1 of 1
4. The following table shows the marks obtained in the test during the first term, x and the marks obtained in the test
Posted: Wed Jul 06, 2022 12:15 pm
by answerhappygod
- 4 The Following Table Shows The Marks Obtained In The Test During The First Term X And The Marks Obtained In The Test 1 (55.75 KiB) Viewed 16 times
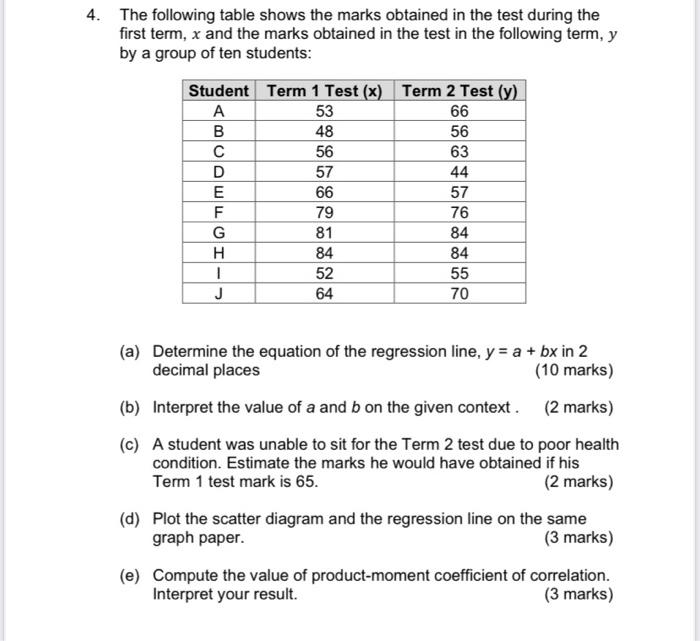
4. The following table shows the marks obtained in the test during the first term, x and the marks obtained in the test in the following term, y by a group of ten students: Student Term 1 Test (x) Term 2 Test (y) A 53 66 48 56 57 66 79 B C D E F G H I J 81 84 52 64 56 63 44 57 76 84 84 55 70 (a) Determine the equation of the regression line, y = a + bx in 2 decimal places (10 marks) (b) Interpret the value of a and b on the given context. (2 marks) (c) A student was unable to sit for the Term 2 test due to poor health condition. Estimate the marks he would have obtained if his Term 1 test mark is 65. (2 marks) (d) Plot the scatter diagram and the regression line on the same graph paper. (3 marks) (e) Compute the value of product-moment coefficient of correlation. Interpret your result. (3 marks)