Page 1 of 1
Not everyone pays the same price for the same model of a car. The figure illustrates a normal distribution for the price
Posted: Wed Jul 06, 2022 11:58 am
by answerhappygod
- Not Everyone Pays The Same Price For The Same Model Of A Car The Figure Illustrates A Normal Distribution For The Price 1 (38.75 KiB) Viewed 13 times
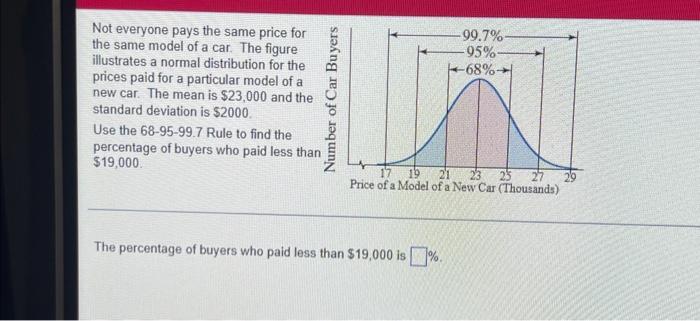
Not everyone pays the same price for the same model of a car. The figure illustrates a normal distribution for the prices paid for a particular model of a new car. The mean is $23,000 and the standard deviation is $2000. Use the 68-95-99.7 Rule to find the percentage of buyers who paid less than $19,000. Number of Car Buyers -99.7% -95%- -68%- 17 19 21 23 25 Price of a Model of a New Car (Thousands) The percentage of buyers who paid less than $19,000 is%.