Page 1 of 1
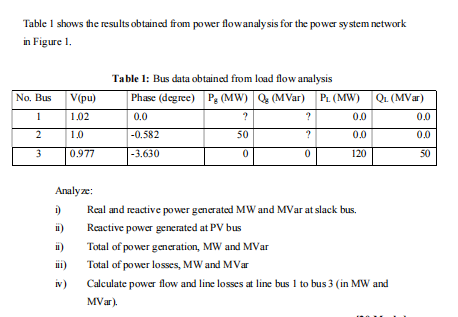
Table 1 shows the results obtained from power flow analysis for the power system network in Figure 1. No. Bus V(pu) 1.02
Posted: Tue Apr 12, 2022 10:12 am
by answerhappygod
- Table 1 Shows The Results Obtained From Power Flow Analysis For The Power System Network In Figure 1 No Bus V Pu 1 02 1 (30.13 KiB) Viewed 45 times
Table 1 shows the results obtained from power flow analysis for the power system network in Figure 1. No. Bus V(pu) 1.02 Table 1: Bus data obtained from load flow analysis Phase (degree) Pg (MW) Q (MVar) PL (MW) Q 0.0 ? ? 0.0 -0.582 50 ? 0.0 -3.630 0 0 120 Qu. (MVar) 0.0 0.0 2 1.0 3 3 0.977 SO Analyze: 1) Real and reactive power generated MW and MVar at slack bus. II) Reactive power generated at PV bus II) Total of power generation, MW and MVar HI) Total of power losses, MW and MVar IV) Calculate power flow and line losses at line bus 1 to bus 3 (in MW and MVar).