Page 1 of 1
The managing director of a company is interested in modelling the relationship between her company's annual profits (EP
Posted: Wed Jul 06, 2022 11:47 am
by answerhappygod
- The Managing Director Of A Company Is Interested In Modelling The Relationship Between Her Company S Annual Profits Ep 1 (59.51 KiB) Viewed 16 times
The managing director of a
company is interested in modelling the relationship between her
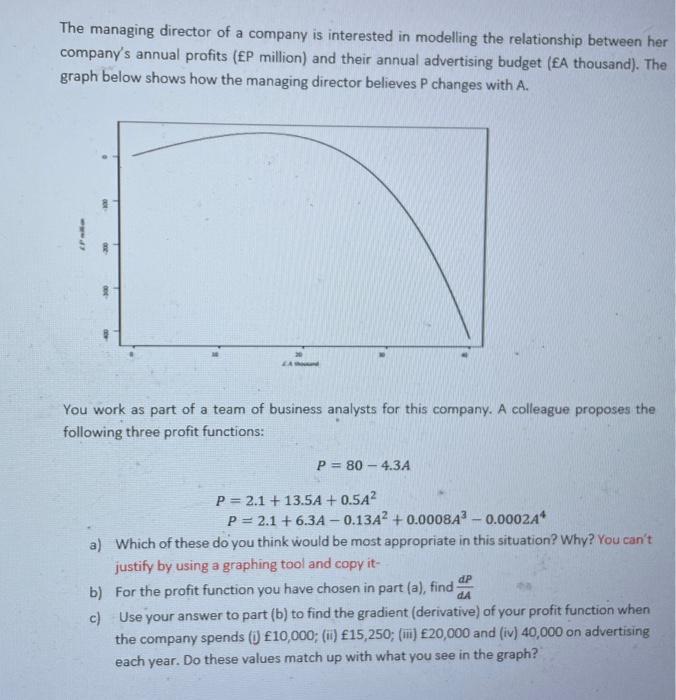
company's annual profits (EP million) and their annual advertising budget (£A thousand). The graph below shows how the managing director believes P changes with A. (PAR A hond You work as part of a team of business analysts for this
company. A colleague proposes the following three profit functions: P = 80-4.3A P = 2.1 + 13.5A + 0.5A² P = 2.1 +6.3A-0.134² +0.00084³ -0.000244 a) Which of these do you think would be most appropriate in this situation? Why? You can't justify by using a graphing tool and copy it- dP b) For the profit function you have chosen in part (a), find d.A c) Use your answer to part (b) to find the gradient (derivative) of your profit function when the
company spends (i) £10,000; (ii) £15,250; (iii) £20,000 and (iv) 40,000 on advertising each year. Do these values match up with what you see in the graph?