Page 1 of 1
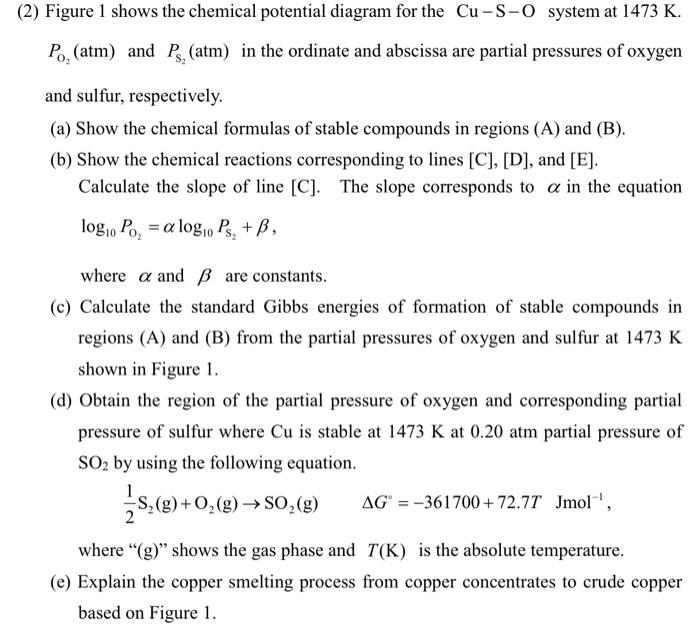
(2) Figure 1 shows the chemical potential diagram for the Cu-S-O system at 1473 K. Po (atm) and P, (atm) in the ordinate
Posted: Wed Jul 06, 2022 10:29 am
by answerhappygod
- 2 Figure 1 Shows The Chemical Potential Diagram For The Cu S O System At 1473 K Po Atm And P Atm In The Ordinate 1 (69.31 KiB) Viewed 13 times
- 2 Figure 1 Shows The Chemical Potential Diagram For The Cu S O System At 1473 K Po Atm And P Atm In The Ordinate 2 (21.6 KiB) Viewed 13 times
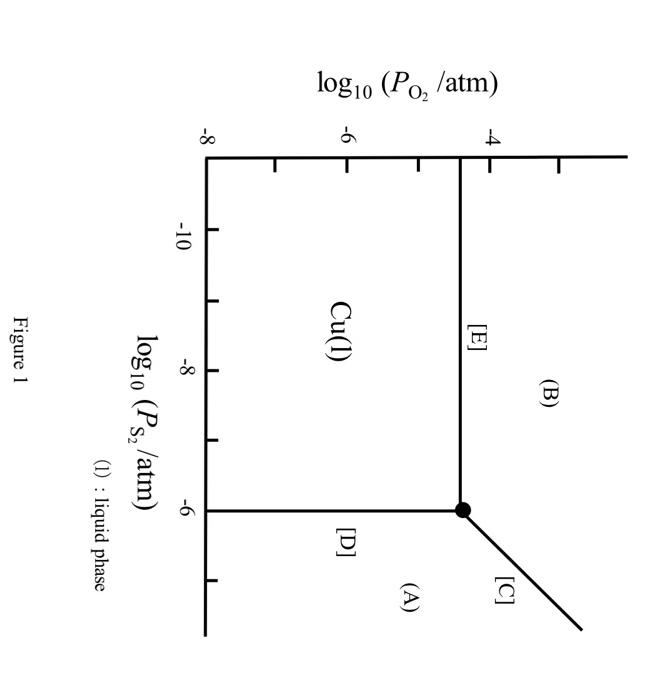
(2) Figure 1 shows the chemical potential diagram for the Cu-S-O system at 1473 K. Po (atm) and P, (atm) in the ordinate and abscissa are partial pressures of oxygen and sulfur, respectively. (a) Show the chemical formulas of stable compounds in regions (A) and (B). (b) Show the chemical reactions corresponding to lines [C], [D], and [E]. Calculate the slope of line [C]. The slope corresponds to a in the equation logio Po₂ = a logio Ps₂ + B, where a and ß are constants. (c) Calculate the standard Gibbs energies of formation of stable compounds in regions (A) and (B) from the partial pressures of oxygen and sulfur at 1473 K shown in Figure 1. (d) Obtain the region of the partial pressure of oxygen and corresponding partial pressure of sulfur where Cu is stable at 1473 K at 0.20 atm partial pressure of SO₂ by using the following equation. S₂(g) + O₂(g) → SO₂(g) AG = -361700+72.77 Jmol, where "(g)" shows the gas phase and T(K) is the absolute temperature. (e) Explain the copper smelting process from copper concentrates to crude copper based on Figure 1.
log10 (Po₂/atm) प -6 -8 -10 [E] Cu(1) (B) -8 log10 (Ps,/atm) -6 Figure 1 [D] [C] (A) (1) : liquid phase