Page 1 of 1
Draw the normal curve with the parameters indicated. Then find the probability of the random variable X. Shade the area
Posted: Mon Apr 11, 2022 6:27 am
by answerhappygod
- Draw The Normal Curve With The Parameters Indicated Then Find The Probability Of The Random Variable X Shade The Area 1 (115.02 KiB) Viewed 42 times
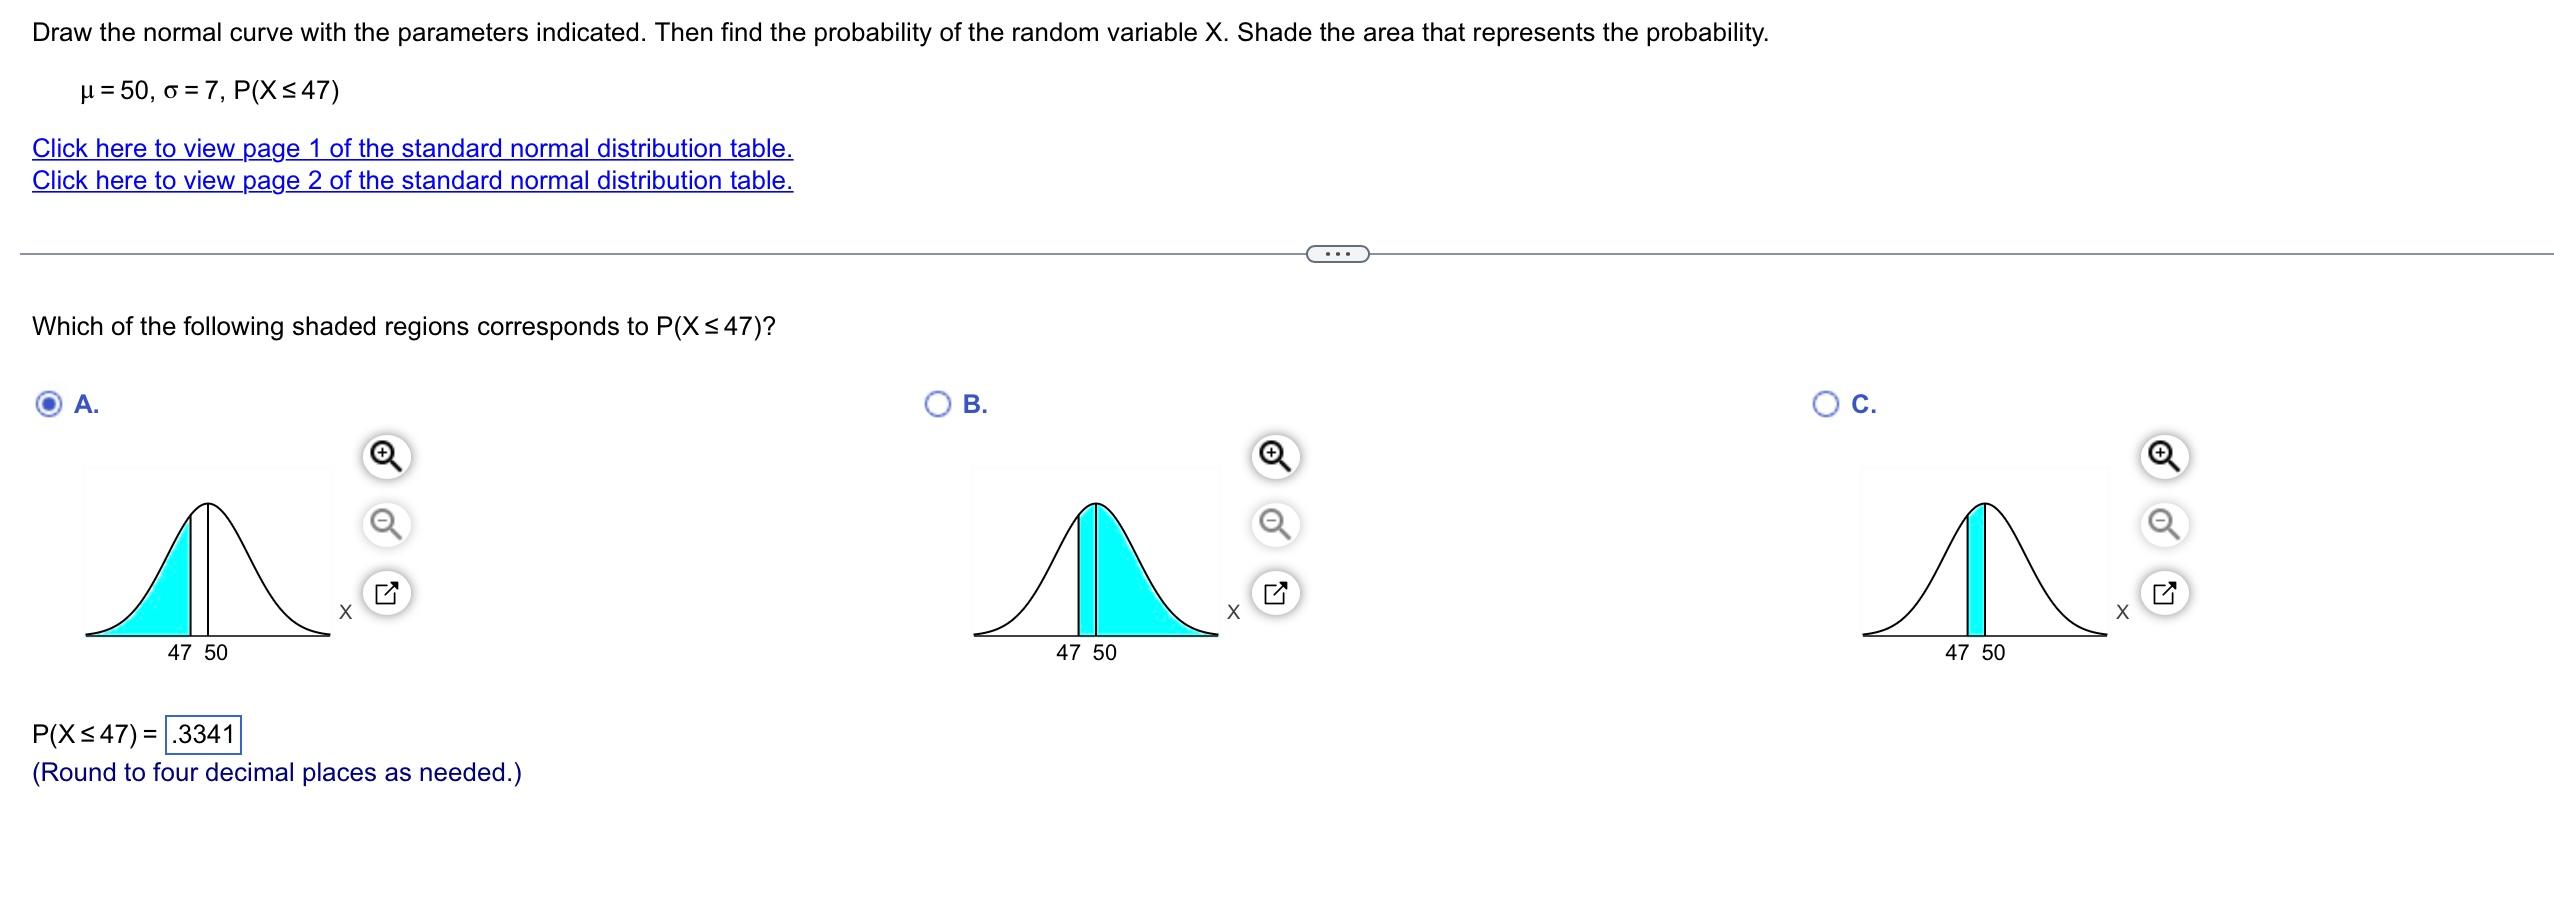
Draw the normal curve with the parameters indicated. Then find the probability of the random variable X. Shade the area that represents the probability. u = 50, o = 7, P(X 547) Click here to view page 1 of the standard normal distribution table. Click here to view page 2 of the standard normal distribution table. Which of the following shaded regions corresponds to P(X 547)? A. ОВ. OC. Q . 1 Х 47 50 47 50 47 50 P(X=47) = .3341 (Round to four decimal places as needed.)