Page 1 of 1
40 In the diagram, D₁ is the initial demand curve for a country's currency, S₁ is the initial supply curve, and OE₁ is t
Posted: Wed Jul 06, 2022 6:21 am
by answerhappygod
- 40 In The Diagram D Is The Initial Demand Curve For A Country S Currency S Is The Initial Supply Curve And Oe Is T 1 (34.93 KiB) Viewed 20 times
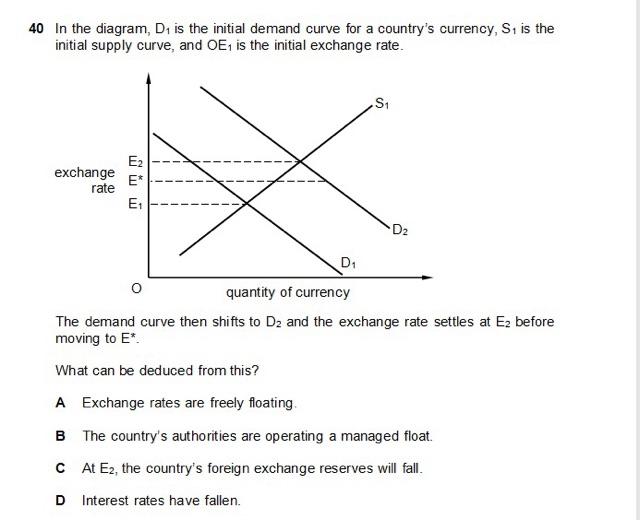
40 In the diagram, D₁ is the initial demand curve for a country's currency, S₁ is the initial supply curve, and OE₁ is the initial exchange rate. S₁ * D₂ D₁ quantity of currency The demand curve then shifts to D₂ and the exchange rate settles at E₂ before moving to E*. What can be deduced from this? A Exchange rates are freely floating. B The country's authorities are operating a managed float. C At E2, the country's foreign exchange reserves will fall. D Interest rates have fallen. exchange rate E₂ E* E₁ 0