Page 1 of 1
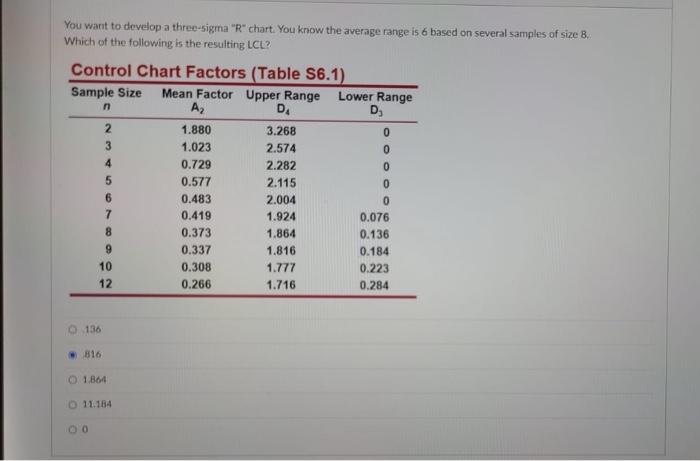
You want to develop a three-sigma "R" chart. You know the average range is 6 based on several samples of size 8. Which o
Posted: Wed Jul 06, 2022 6:07 am
by answerhappygod
- You Want To Develop A Three Sigma R Chart You Know The Average Range Is 6 Based On Several Samples Of Size 8 Which O 1 (25.73 KiB) Viewed 12 times
You want to develop a three-sigma "R" chart. You know the average range is 6 based on several samples of size 8. Which of the following is the resulting LCL? Control Chart Factors (Table S6.1) Sample Size Mean Factor Upper Range A₂ n D₁ 1.880 1.023 0.729 0.577 0.483 0.419 0.373 0.337 0.308 0.266 136 816 2 10 12 00 3 4 6 7 8 9 O 1.864 O 11.184 3.268 2.574 2.282 2.115 2.004 1.924 1.864 1.816 1.777 1.716 Lower Range D₂ 0 0 0 0 0 0.076 0.136 0.184 0.223 0.284