Page 1 of 1
Refer to Table 56.1-Factors for Computing Control Chart Limits (3 sigma) for this problem. Sampling 4 pieces of precisio
Posted: Wed Jul 06, 2022 6:06 am
by answerhappygod
- Refer To Table 56 1 Factors For Computing Control Chart Limits 3 Sigma For This Problem Sampling 4 Pieces Of Precisio 1 (24.83 KiB) Viewed 11 times
- Refer To Table 56 1 Factors For Computing Control Chart Limits 3 Sigma For This Problem Sampling 4 Pieces Of Precisio 2 (50.44 KiB) Viewed 11 times
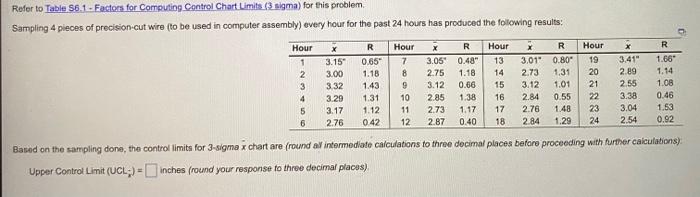
Refer to Table 56.1-Factors for Computing Control Chart Limits (3 sigma) for this problem. Sampling 4 pieces of precision-cut wire (to be used in computer assembly) every hour for the past 24 hours has produced the following results: Hour 1 2 3 4 x 3.15 3.00 R Hour 0.65 7 1.18 8 9 10 11 3.32 1.43 3.29 1.31 3.17 1.12 2.76 0.42 X X R R Hour 3.05 0.48" 13 3.01" 0.80" 2.75 1.18 14 2.73 1.31 20 3.12 0.66 15 3.12 1.01 2.85 1.38 16 2.84 2.73 1.17 17 2.76 12 2.87 0.40 18 2.84 1.29 0.55 1.48 Based on the sampling done, the control limits for 3-sigma x chart are (round all intermediate calculations to three decimal places before proceeding with further calculations) Upper Control Limit (UCL;) - inches (round your response to three decimal places). 5 6 R 3.41" 1.66 2.89 1.14 1.08 2.55 3.38 0.46 1.53 23 3.04 24 2.54 0.92 Hour 222882 19 21
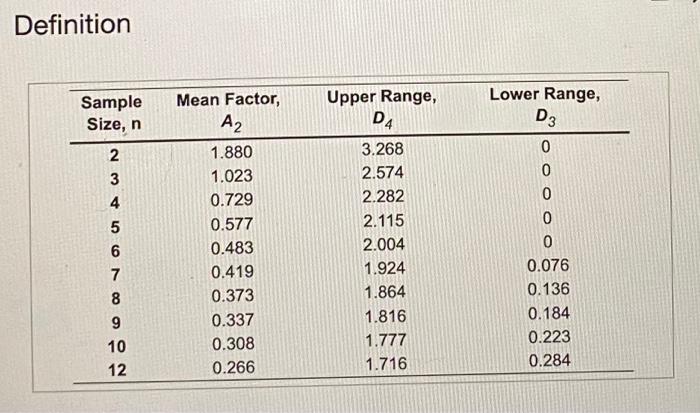
Definition Sample Size, n 234 2 5 6 7 8 9 10 12 Mean Factor, A₂ 1.880 1.023 0.729 0.577 0.483 0.419 0.373 0.337 0.308 0.266 Upper Range, D4 3.268 2.574 2.282 2.115 2.004 1.924 1.864 1.816 1.777 1.716 Lower Range, D3 0 0 0 0 0 0.076 0.136 0.184 0.223 0.284