Page 1 of 1
The table shows data on the average annual global temperatures for the years between 1994 and 2014 in degrees Celsius. Y
Posted: Tue Jul 05, 2022 9:21 am
by answerhappygod
- The Table Shows Data On The Average Annual Global Temperatures For The Years Between 1994 And 2014 In Degrees Celsius Y 1 (30.79 KiB) Viewed 12 times
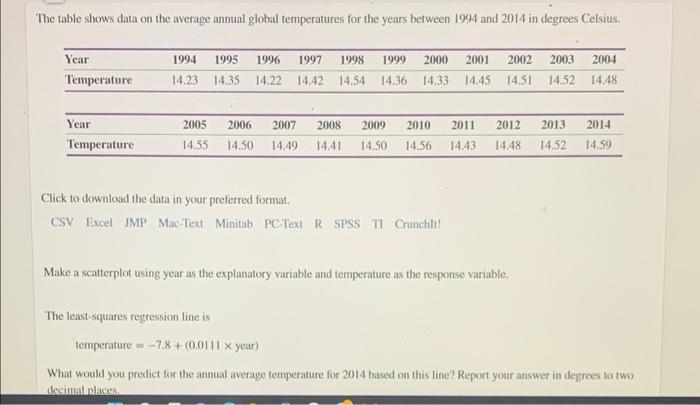
The table shows data on the average annual global temperatures for the years between 1994 and 2014 in degrees Celsius. Year Temperature Year Temperature 1994 1995 1996 1997 1998 1999 2000 2001 2002 2003 2004 14.23 14.35 14.22 14.42 14.54 14.36 14.33 14.45 14.51 14.52 14.48 2005 2006 2007 14.55 14.50 14.49 2008 2009 2010 2011 2012 2013 2014 14.41 14.50 14.56 14.43 14.48 14.52 14.59 Click to download the data in your preferred format. CSV Excel JMP Mac-Text Minitab PC Text R SPSS TI Crunchlt! Make a scatterplot using year as the explanatory variable and temperature as the response variable. The least-squares regression line is temperature= -7.8+ (0.0111 x year) What would you predict for the annual average temperature for 2014 based on this line? Report your answer in degrees to two decimal places.