- 21 See Problem 15 State The Technical Conclusion Based On The Pvalue Method A The Pvalue Is Less Than Alpha I Concl 1 (65.29 KiB) Viewed 13 times
- 21 See Problem 15 State The Technical Conclusion Based On The Pvalue Method A The Pvalue Is Less Than Alpha I Concl 2 (32.65 KiB) Viewed 13 times
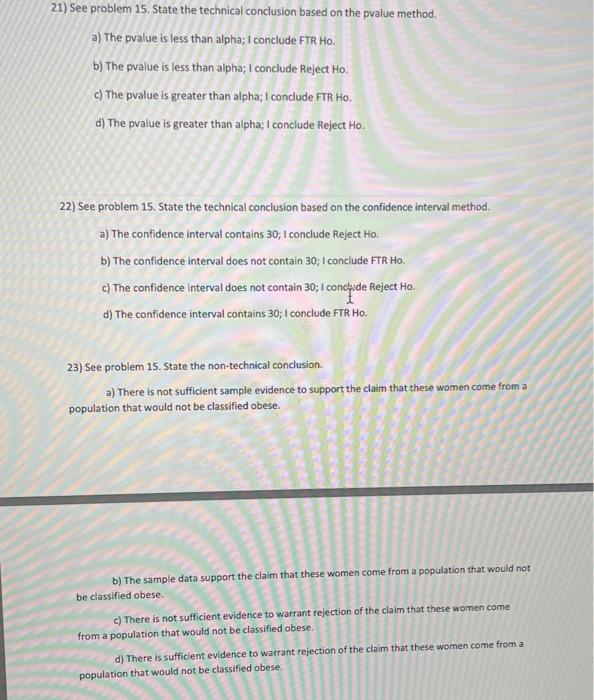
21) See problem 15. State the technical conclusion based on the pvalue method. a) The pvalue is less than alpha; I conclude FTR Ho. b) The pvalue is less than alpha; I conclude Reject Ho. c) The pvalue is greater than alpha; I conclude FTR Ho. d) The pvalue is greater than alpha; I conclude Reject Ho. 22) See problem 15. State the technical conclusion based on the confidence interval method. a) The confidence interval contains 30; 1 conclude Reject Ho. b) The confidence interval does not contain 30; i conclude FTR Ho. c) The confidence interval does not contain 30; I conclude Reject Ho. d) The confidence interval contains 30; I conclude FTR Ho. 23) See problem 15. State the non-technical conclusion. a) There is not sufficient sample evidence to support the claim that these women come from a population that would not be classified obese. b) The sample data support the claim that these women come from a population that would not be classified obese. c) There is not sufficient evidence to warrant rejection of the claim that these women come from a population that would not be classified obese. d) There is sufficient evidence to warrant rejection of the claim that these women come from a population that would not be classified obese..
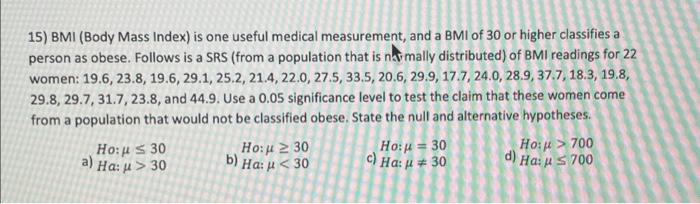
15) BMI (Body Mass Index) is one useful medical measurement, and a BMI of 30 or higher classifies a person as obese. Follows is a SRS (from a population that is nymally distributed) of BMI readings for 22 women: 19.6, 23.8, 19.6, 29.1, 25.2, 21.4, 22.0, 27.5, 33.5, 20.6, 29.9, 17.7, 24.0, 28.9, 37.7, 18.3, 19.8, 29.8, 29.7, 31.7, 23.8, and 44.9. Use a 0.05 significance level to test the claim that these women come from a population that would not be classified obese. State the null and alternative hypotheses. Ho:μ ≤ 30 a) Ha: μ > 30 Ho: μ ≥ 30 b) Ha: μ < 30 Ho:μ = 30 c) Ha: μ # 30 Ho:μ > 700 d) Ha: ≤ 700