Page 1 of 1
1,03 201 900 oble +5) VO Figure 1 Question 1-(20pts) The block diagram in figure I represents an automobile speed contro
Posted: Sun Jul 03, 2022 12:13 pm
by answerhappygod
- 1 03 201 900 Oble 5 Vo Figure 1 Question 1 20pts The Block Diagram In Figure I Represents An Automobile Speed Contro 1 (25.64 KiB) Viewed 17 times
1,03 201 900 oble +5) VO Figure 1
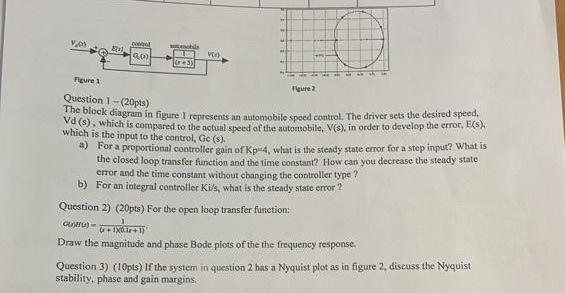
Question 1-(20pts) The block diagram in figure I represents an automobile speed control. The driver sets the desired speed, Vd (s), which is compared to the actual speed of the automobile, V(s), in order to develop the error, E(S). which is the input to the control, Ge (s). a) For a proportional controller gain of Kp-4, what is the steady state error for a step input? What is the closed loop transfer function and the time constant? How can you decrease the steady state error and the time constant without changing the controller type ? b) For an integral controller Ki/s, what is the steady state error ? Figure 2
Question 2) (20pts) For the open loop transfer function: Quru)-((x+1) Draw the magnitude and phase Bode plots of the the frequency response.
Question 3) (10pts) If the system in
question 2 has a Nyquist plot as in figure 2, discuss the Nyquist stability, phase and gain margins.